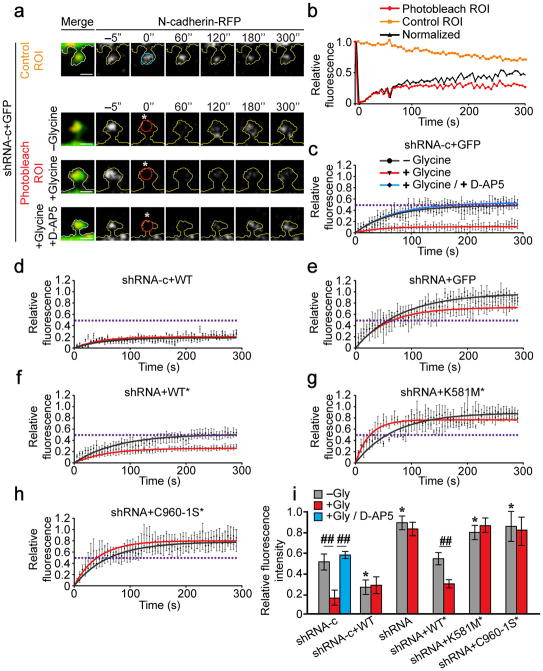
Figure 3. δ-catenin palmitoylation is required for activity-induced stabilization of N-cadherin within dendritic spine heads.
(a) Cells were photobleached at 0 s (”; white asterisk) within a 1μm diameter ROI. Fluorescence within a photobleached ROI (red circle) was normalized to non-photobleached ROI in adjacent spines (blue circle). Scale bar=1μm. (b) Fluorescence recovery within photobleached and non-photobleached ROIs (from top two panels in a) and the normalization for bleaching. (c–h) Normalized fluorescence recovery of N-cadherin-RFP. Dashed lines represent the plateau for fluorescence recovery in control cells (c). Points with error bars represent mean ± SEM, solid lines represent single exponential fit. Statistical tests compare plateau values from exponential fits ± SEM. Neurons were obtained from ≥ 3 separate cultures. (c) n=10 cells, −glycine; 15 cells, +glycine; n=5 cells, glycine+D-AP5; p=0.003, F2,27=7.15, one-way ANOVA. (d) n=11 cells, –glycine; 5 cells, +glycine; p=0.991; student’s t-test. (e) n=18 cells, −glycine; 8 cells, +glycine; p=0.099, student’s t-test). (f) n=18 cells, −glycine; 9 cells, +glycine; p=0.003, student’s t-test. (g) n=12 cells, −glycine; 9 cells, +glycine; p=0.223, student’s t-test. (h) n=25 cells, −glycine; 8 cells, +glycine; p=0.92, t-test. (i) The mobile fraction of N-cadherin-RFP (fluorescence within the ROI at the 5 min time point, normalized for photobleaching; mean ± SEM; p<0.001, F12,140=8.03; one-way ANOVA). *p<0.05, one-way ANOVA, Tukey’s test post hoc, relative to control cells expressing shRNA-c, in the absence of glycine; ##p<0.01, Tukey’s test post hoc, relative to same transfection condition in the absence of glycine.

