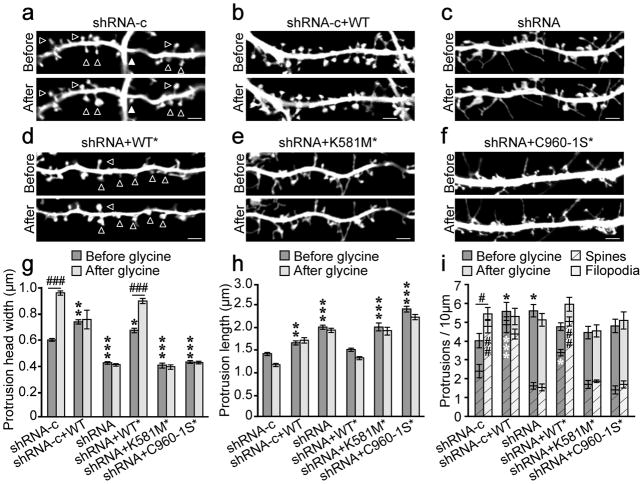
Figure 4. δ-catenin palmitoylation is required for activity-induced spine remodeling.
Primary dendrites were imaged before and again 40–60 min after glycine treatment. (a) n=12 cells, 803 spines; (b) n=7 cells, 396 spines; (c) n=10 cells, 529 spines, (d) n=10 cells, 606 spines; (e) n=8 cells, 352 spines; (f) n=10 cells, 535 spines. Scale bar=2μm. (g) Protrusion head width before and after glycine treatment (p<0.001, F5,6430=127.57 [between groups effect]; p<0.001, F1,6430=43.13 [glycine treatment effect]). (h) Length of protrusions before and after glycine treatment (p<0.001, F5,6430=213.45 [between groups effect]; p<0.001, F1,6430=11.57 [glycine treatment effect]. (i) The density of total protrusions (mean represented by crosshatched bars plus solid bars; top error bars represent total protrusion SEM; p=0.005, F5,102=2.23 [between groups effect]; p=0.04, F1,102=4.32 [glycine treatment effect]; two-way ANOVA), filopodia (solid bars), and spines (crosshatched bars ± SEM; p<0.001, F5,102=65.05 [between groups effect]; p<0.001, F5,102=18.71 [glycine treatment effect]; two-way ANOVA) before and after glycine treatment. Cells were obtained from ≥3 separate cultures. Graphs represent mean ± SEM. (g, h) *p<0.05, **p<0.01, ***p<0.001; two-way ANOVA, Bonferonni’s test post hoc, relative to shRNA-c before glycine treatment. ###p<0.001; Bonferonni’s test post hoc, relative to same condition before glycine. (i) *(black) above bars compare total protrusions relative to shRNA-c cells before glycine, *(white) within crosshatched bars compare spines relative to shRNA-c before glycine; # above bars compare total protrusions within groups before and after glycine, # within crosshatched bars compare spines within groups before and after glycine. #/*p<0.05, ##/**p<0.01, ***p<0.001 two-way ANOVA, Bonferonni’s test post-hoc.

