. 2016 Aug 19;5:e15133. doi: 10.7554/eLife.15133

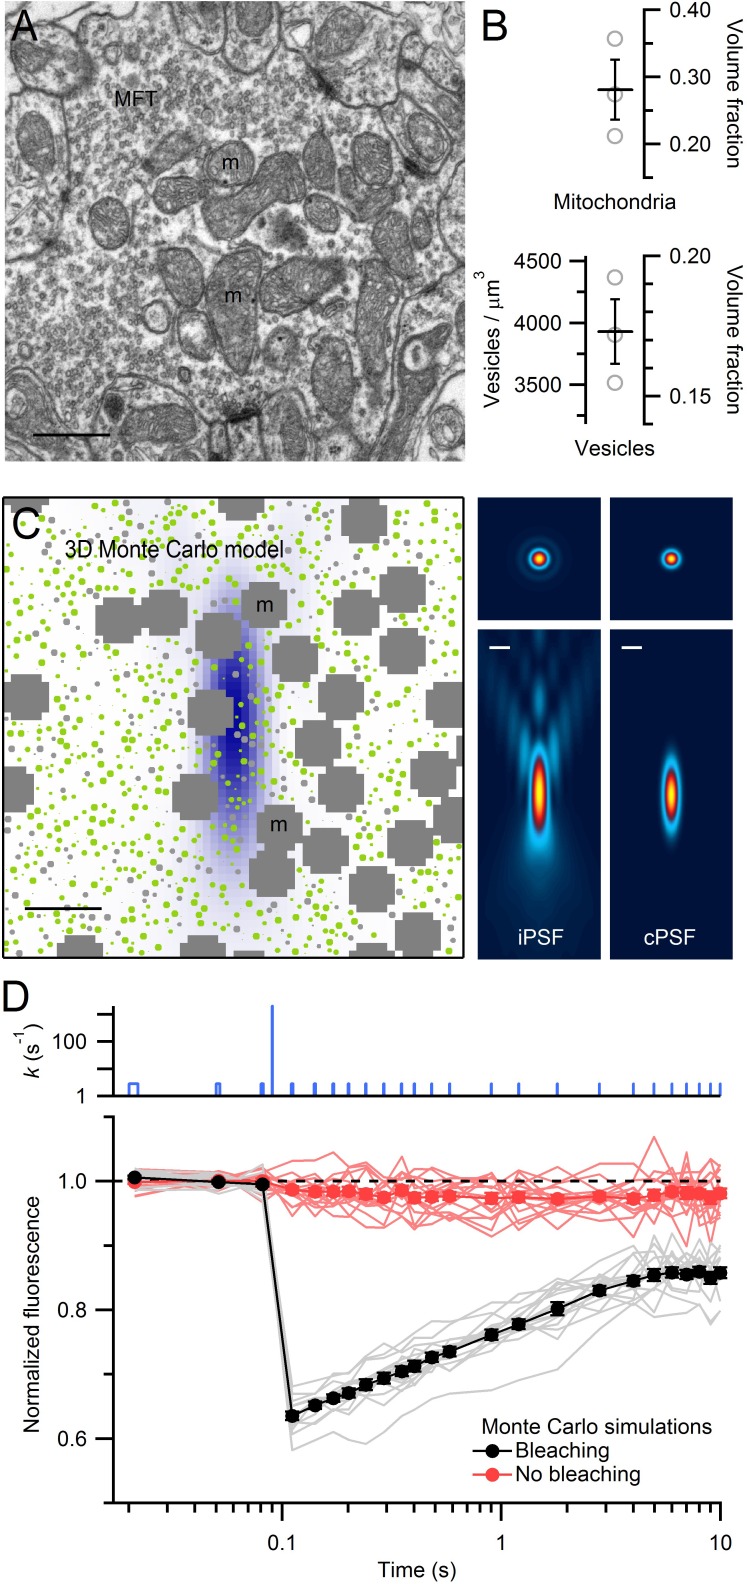
Figure 3. EM measurements of vesicle and mitochondrial densities within MFTs and Monte Carlo simulations of FRAP experiments.

(A) Electron micrograph of a cerebellar MFT from adult mouse showing vesicles and mitochondria (m). Scale bar: 0.5 µm. (B) Mean density of vesicles and mitochondria (black lines) computed from electron micrographs from 3 MFTs (gray circles), where the vesicle density is computed for the non-mitochondrial volume. Vesicle volume fraction was computed assuming a diameter of 44 nm in fixed tissue (Figure 3—figure supplement 1E). (C) Left: xz cross section (3 × 3 µm) through the 3D Monte Carlo model of the MFT simulating live tissue conditions, showing randomly placed 49 nm vesicles (0.17 volume fraction) that are mobile (green) or immobile (light gray, 25%), and clusters of mitochondria (dark gray, 0.28 volume fraction). Differences in vesicle diameters reflect their different cross sections in a single plane. Blue shading denotes iPSF. Right: xy (top, 3 × 3 µm) and xz (bottom: 3 × 7 µm) cross sections of iPSF and cPSF (Figure 3—figure supplement 2). Scale bars: 0.5 µm. (D) FRAP simulations for model in C with (black) and without (red) the bleaching pulse, showing individual trials (lines) and averages (filled circles). Top: bleaching rate (k) of Equation (4) used for probe and bleaching pulses.

DOI: http://dx.doi.org/10.7554/eLife.15133.011

Figure 3—source data 1. Density of vesicles and mitochondria.
DOI: 10.7554/eLife.15133.012

Figure 3.

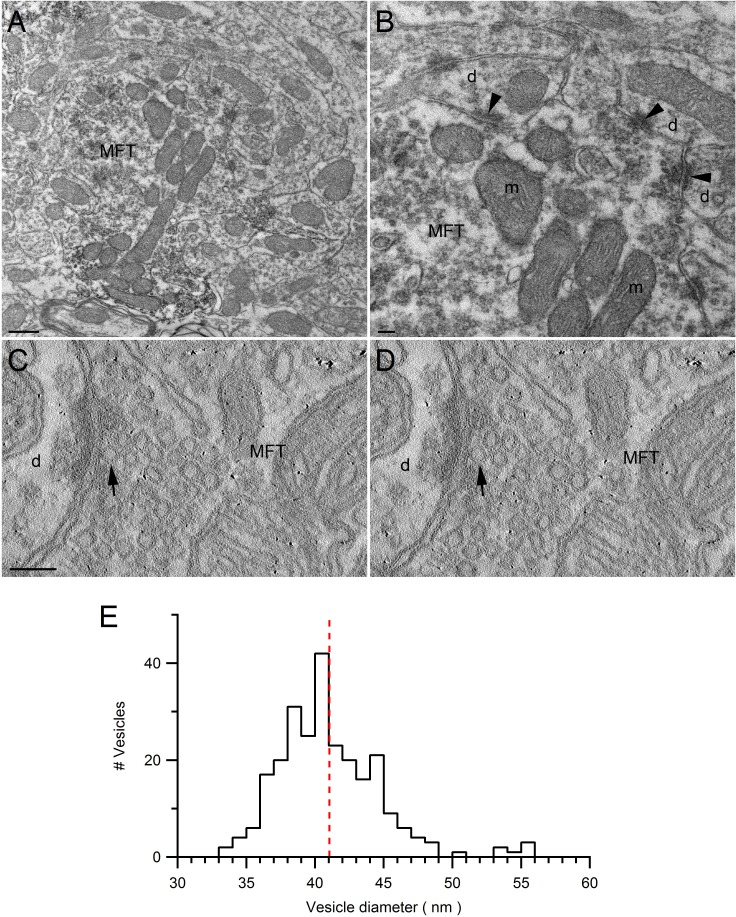
Figure 3—figure supplement 1. Ultrastructure of VGLUT1-Venus expressing MFTs and measurements of vesicle diameter.

Figure 3—figure supplement 1.

(A,B) Low (A) and high (B) magnification EM images of the cerebellar GC layer showing a VGLUT1Venus-immunopositive MFT. The higher magnification in B shows asymmetrical synapses (arrowheads) made by the MFT with GC dendrites (d). The MFT contains a cluster of mitochondria (m) in the middle and high density of synaptic vesicles. Scale bars: 400 nm (A) and 100 nm (B). (C,D) EM tomographic subvolumes (0.6 nm thick, 6 nm apart) of a MFT making an asymmetrical synapse with a GC dendrite. Arrows denote a docked synaptic vesicle. Such segmentation views were used to find the largest diameter of each vesicle. Scale bar: 100 nm. (E) Distribution of synaptic vesicle diameters (n = 256; 1 nm bins) has a mean of 41.1 ± 0.2 nm (calculated from 3 tomographic subvolumes). Taking into account the proteins that extend ~1.2 nm from the vesicle membrane (Takamori et al., 2006), and the cubic relationship between vesicle radius and volume, the mean volume occupied by a vesicle is equivalent to a sphere with 44 nm diameter.
Figure 3—figure supplement 1—source data 1. Synaptic vesicle diameters.
DOI: 10.7554/eLife.15133.014
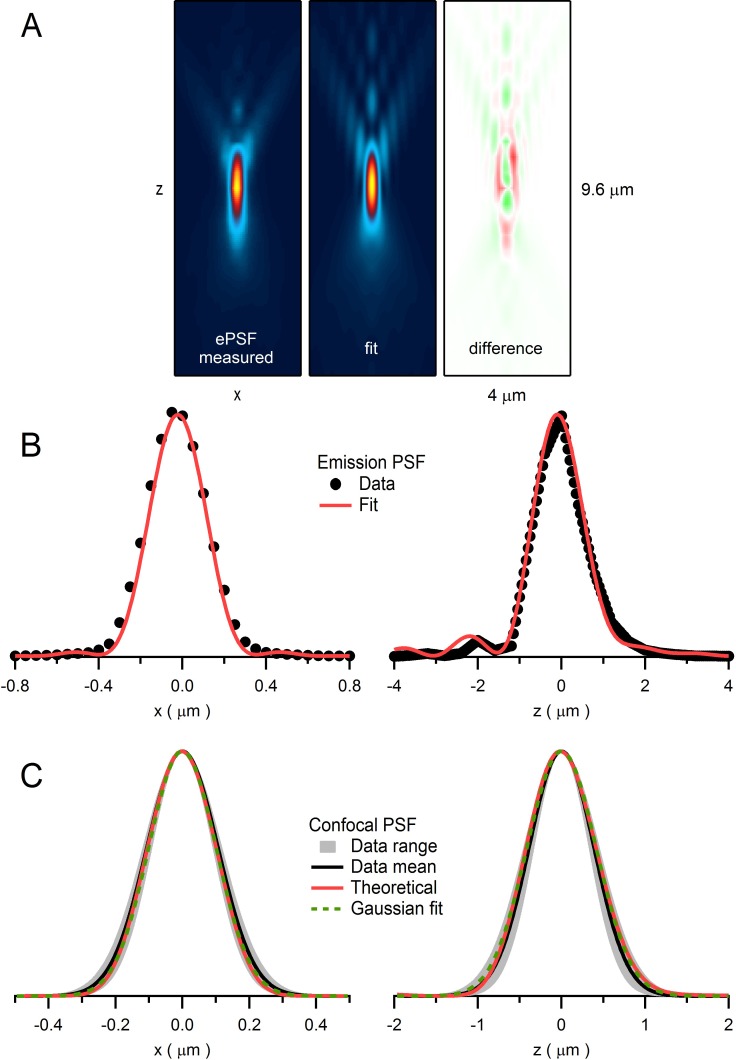
Figure 3—figure supplement 2. Quantification of emission and confocal point spread functions.

Figure 3—figure supplement 2.

(A) The emission point spread function (ePSF) measured from fluorescence emitted from an imaged bead as previously described (DiGregorio et al., 2007). Left: xz plane (y = 0; 4.0 × 9.6 µm) of a 3D wide-field ePSF created from axial images (xy plane; 1 pixel = 0.05 µm) of a 110 nm fluorescent bead (Molecular Probes yellow-green FluoSpheres: 505 nm excitation, 515 nm emission) taken in multiple planes in 0.4 µm steps (dz). The resolution in the axial plane was increased by a factor of 8 (i.e. dz = 0.05 µm) by cubic spline interpolation. Vertical symmetry along x-axis was created by averaging. Values were normalized between 0 and 1, displayed with a colour scale from blue to yellow. Middle: 2D fit of ePSF to a diffraction integral representation of a high-NA objective (Sheppard and Torok, 1997) that includes a sin2θ series function to account for spherical aberrations (DiGregorio et al., 2007). Right: difference between ePSF and the 2D fit displayed with a colour scale from green (−0.14) to red (+0.14). (B) 1D profiles of ePSF and the fit in A along x-axis (left; y = 0, z = 0) and z-axis (right; x = 0, z = 0). (C) Left: 1D profile of the average confocal PSF (cPSF) in the x-axis (black line; FWHMxy = 255 nm) and range (gray; FWHMxy = 218–336 nm) computed from fluorescence measured from 110 nm beads as a focused laser spot (488 nm) was stepped across their lateral dimensions. Plots of average fluorescence versus spot location were fit with a Gaussian function and the resulting Gaussian widths were corrected for bead size using deconvolution (Chaigneau et al., 2011): FWHMactual = [(FWHMmeasured)2 – (FWHMbead)2]1/2. Red line is derived from a theoretical cPSF (Wilson and Carlini, 1987). Green dashed line is a Gaussian fit to the theoretical cPSF (FWHMxy = 238 nm). Right: 1D profile of the average cPSF in the z-axis (black line; FWHMz = 916 nm, range 780–1047 nm), with theoretical cPSF (red line) and its Gaussian fit (green dashed line; FWHMz = 975 nm).