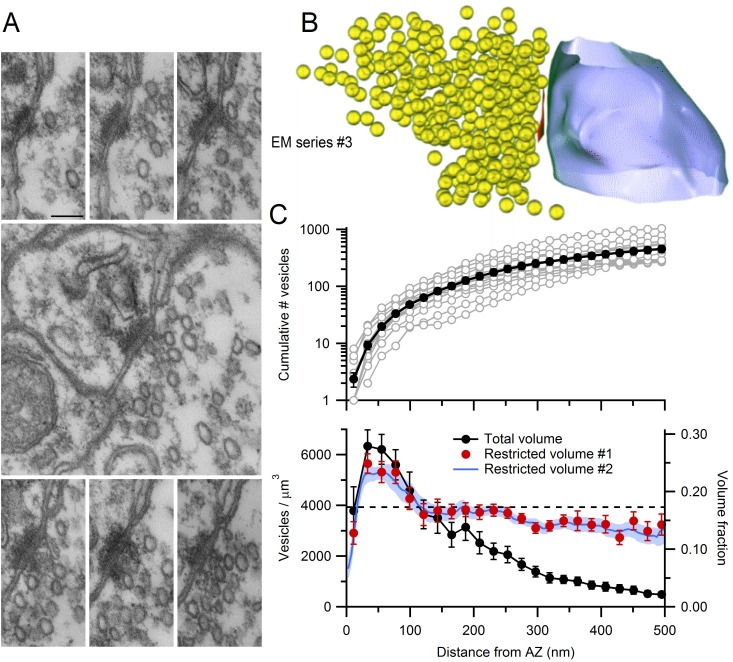
Figure 6. EM measurements of vesicle density near MFT AZs.
(A) Serial-section electron micrographs containing a cerebellar MFT-GC synaptic junction (EM series #3). Scale bar: 100 nm. (B) 3D reconstruction of the synapse in A showing an AZ (red), synaptic vesicles (yellow) and postsynaptic GC dendrite (blue). (C) Vesicle count (top) as a function of distance from the AZ computed from 3D reconstructions as in B (n = 14; 22 nm bins). Counts of 0 for first bin are not shown (n = 3). Vesicle density (bottom; left axis; count per volume) for the total volume surrounding the AZ (black) or restricted volume within the vesicle cloud (red circles), and the vesicle volume fraction within the vesicle cloud computed using 4.4 nm voxels (blue line; right axis). Dashed line denotes vesicle density measured at the centre of the MFT (Figure 3B).
DOI: http://dx.doi.org/10.7554/eLife.15133.021

