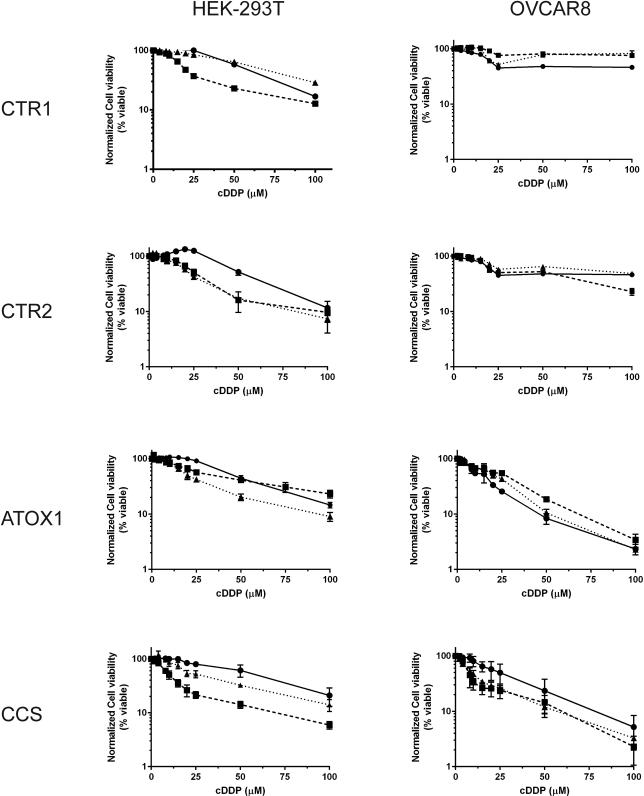
Figure 2.
cDDP concentration-survival curves for the wild type HEK293T and OVCAR8 cell lines and each of the knockout clones. Cells were seeded in 96 well plates and treated with 0-100 μM cDDP for 1 h and then incubated in drug-free medium for an additional 4 days. The data represent the mean ± SEM of three independent experiments plated in sextuplicate for each drug concentration. For all cell lines circles (λ, solid line) represent WT, squares represent KO1 (ν, dashed line), and triangles (π, dotted line) represent KO2.

