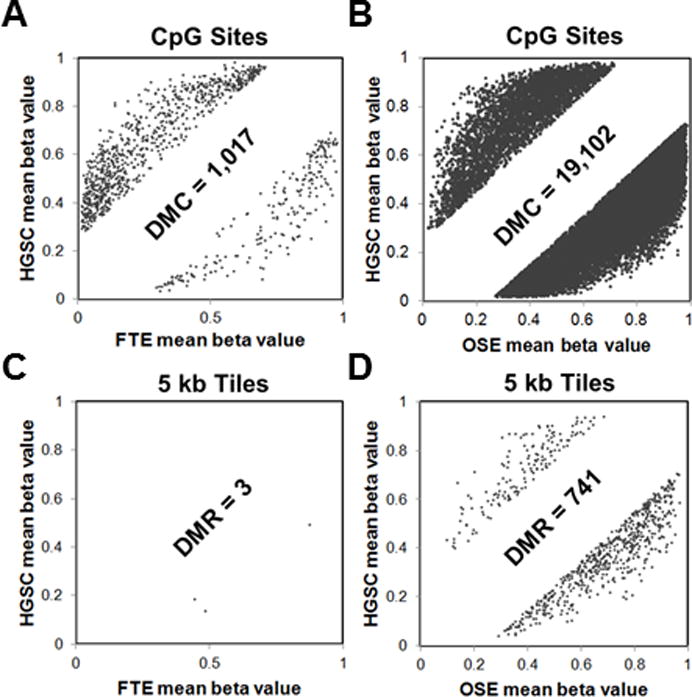
Figure 1.

Differential methylation of HGSC vs. patient-matched FTE or OSE, using Karpf 450K data. Each panel shows an x-y plot of the mean methylation beta value of specific CpG sites or 5kb tile regions in HGSC (y-axes) and FTE or OSE (x-axes). Sites or regions without a significant change in methylation are not shown (blank regions in middle of graphs). Sites or regions with increased methylation in HGSC are indicated on the top left of graphs, while sites or regions with increased methylation in FTE or OSE are indicated on the bottom right of graphs. (A) DMC comparison of HGSC (n=10) and FTE (n=5) (DMC = mean CpG methylation beta value difference ≥ 25%; FDR adjusted p-value <0.05). (B) DMC comparison of HGSC (n=10) and OSE (n=5), as described in A. (C) DMR comparison between HGSC (n=10) and FTE (n=5). DMR were 5kb tiles (n=131,408) with a mean beta value difference of ≥ 25% and an FDR-adjusted p-value of <0.05. (D) Comparison of HGSC (n=10) and OSE (n=5), as described in C. The total number of DMC and DMR meeting the differential cutoff in each comparison is indicated on the figure. All analyses were performed using RnBeads (see Methods).
