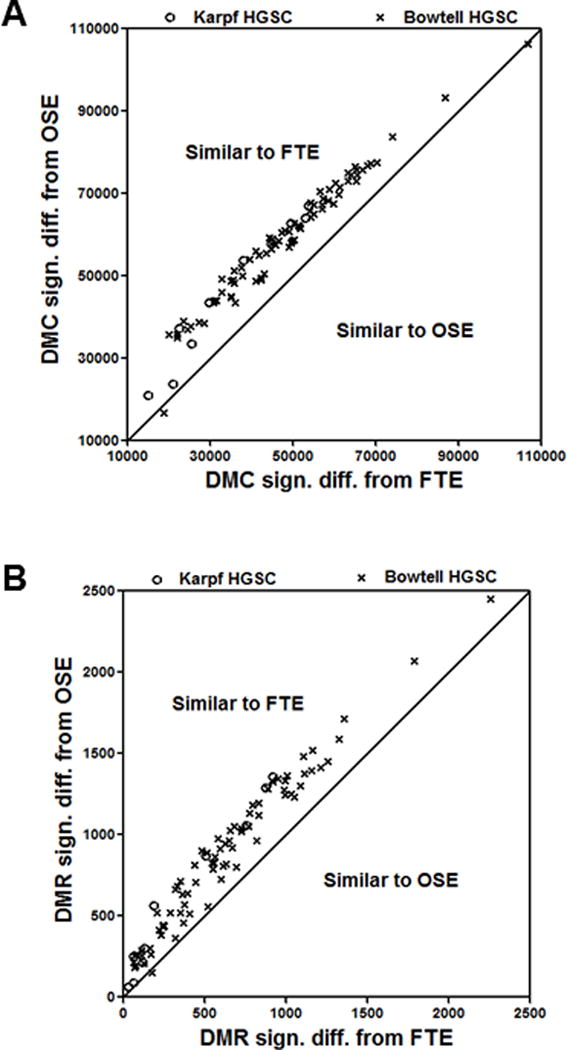
Figure 5.

Individual HGSC sample methylation differences as compared to patient-matched FTE or OSE group averages. DNA methylation data from Karpf 450K for HGSC (n=10), FTE (n=5), and OSE (n=5), and Bowtell 450K HGSC data (n=78) were utilized. (A) DMC between Karpf and Bowtell HGSC samples and FTE or OSE. (B) DMR between Karpf and Bowtell HGSC samples and FTE or OSE. In both panels, a Wald test p-value of ≤ 0.05 was used.
