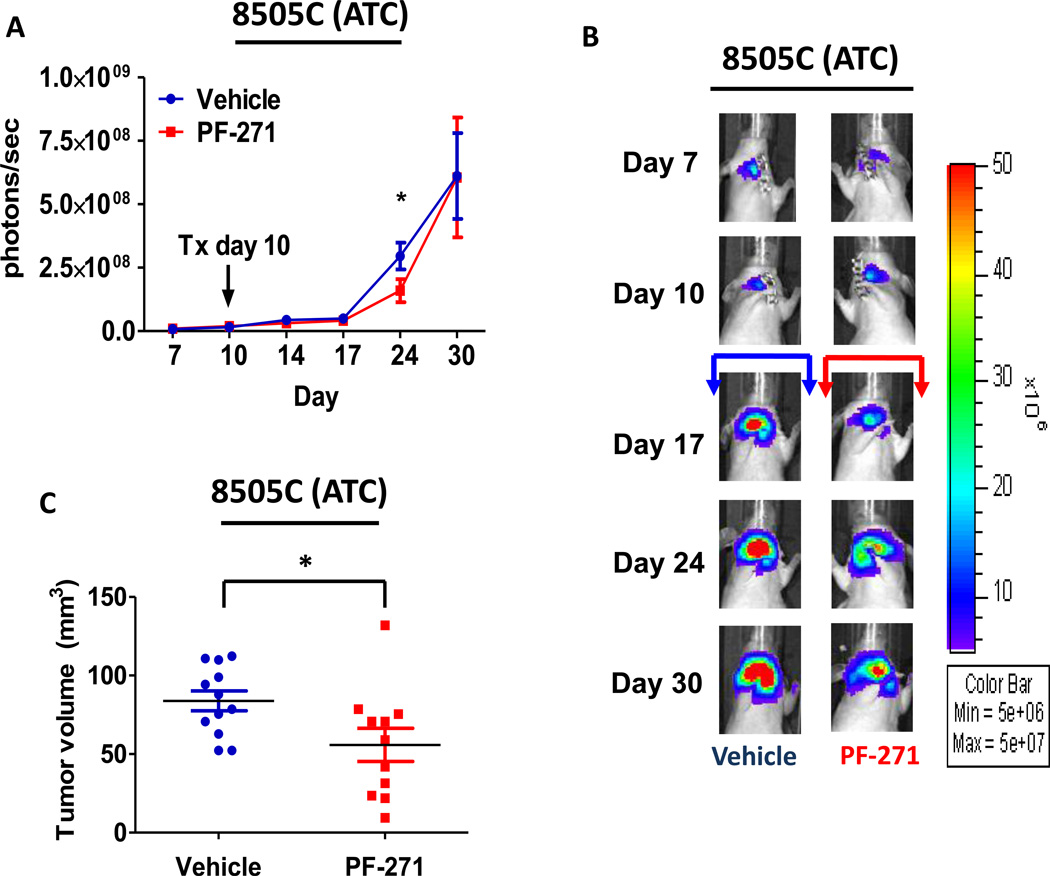
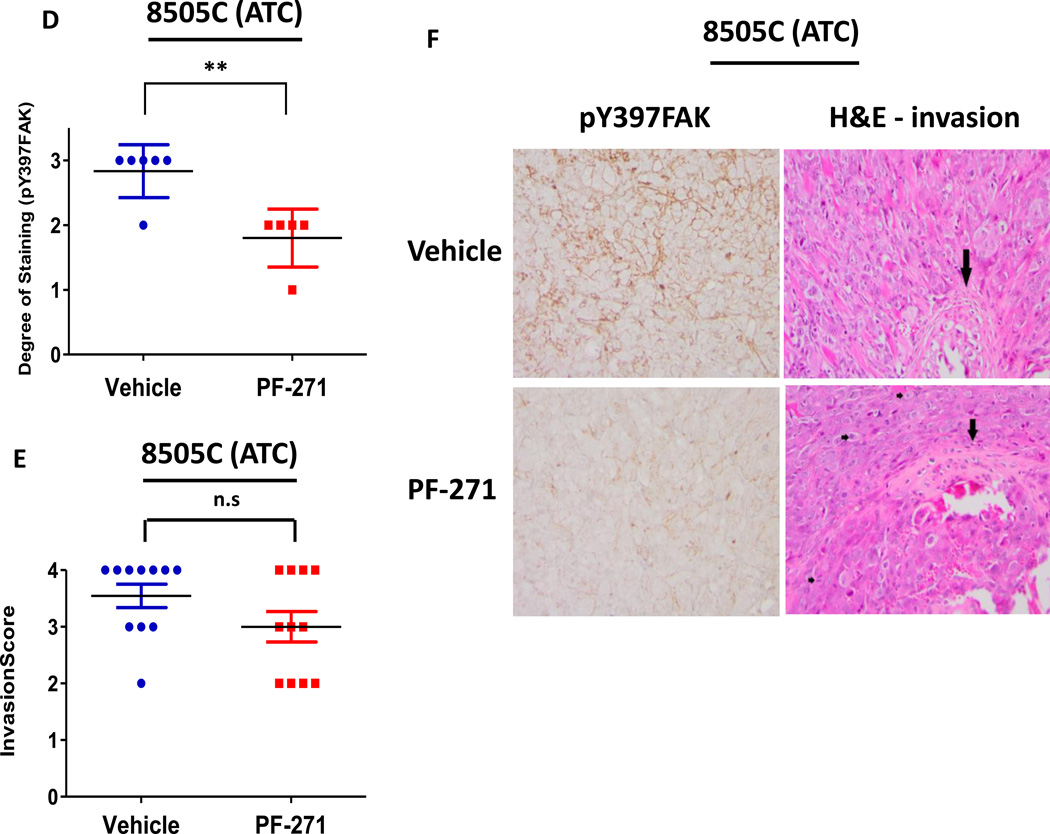
Figure 4. ATC orthotopic tumor growth is reduced with FAK kinase inhibition.
Mice were injected with 8505C cells, randomized, and treated on day 10 with 50 mg/kg of PF-562,271 or vehicle for 30 days. (A) 8505C tumor growth overtime was observed via bioluminescence signaling (day 24, p≤0.05, t-test). Results shown are mean bioluminescence signal (photons/second) per group ± SEM at the indicated time points. (B) Representative bioluminescence images for 8505C are shown. (C) 8505C tumors were collected at day 30 and size was measured with calipers. The final tumor volumes were calculated (p≤0.05, t-test). (D) IHC staining on 8505C tumors was performed on sections of each tumor and scored as degree of positive staining by a pathologist. Results are degree of staining ± SD (p≤0.01, t-test). (E) H&E staining on 8505C tumors was performed on sections of each tumor. The percent of invasion was scored and calculated by a pathologist. Results are invasion scores ± SEM (p = n.s). (F) Representative images from IHC staining of pY397FAK (left) and H&E (right) of vehicle and PF-271 treated tumors are shown (200× magnification). H&E of vehicle-treated tumor shows invasion of poorly differentiated carcinoma through cartilage of trachea (large arrow). H&E of PF-271-treated tumor shows invasion of poorly differentiated carcinoma through cartilage of trachea (large arrow). Small arrows demonstrate numerous mitotic figures. (Hematoxylin-eosin, original magnification × 200).


