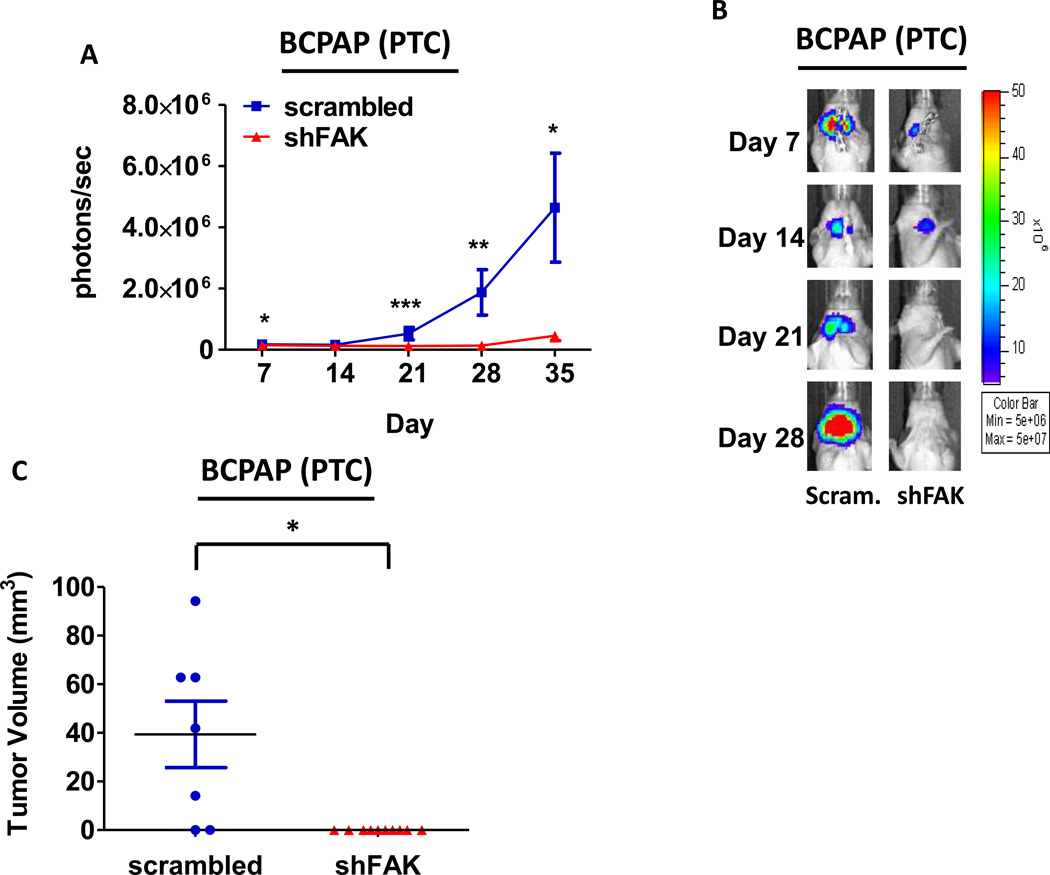
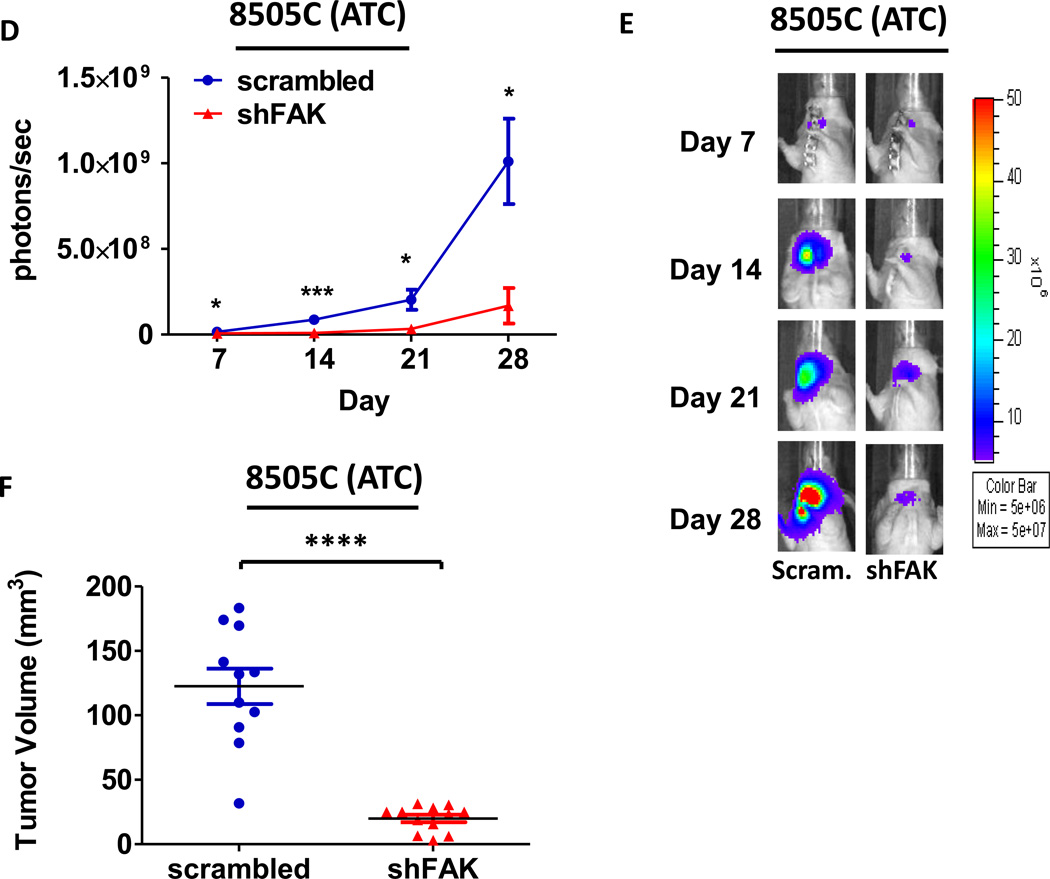
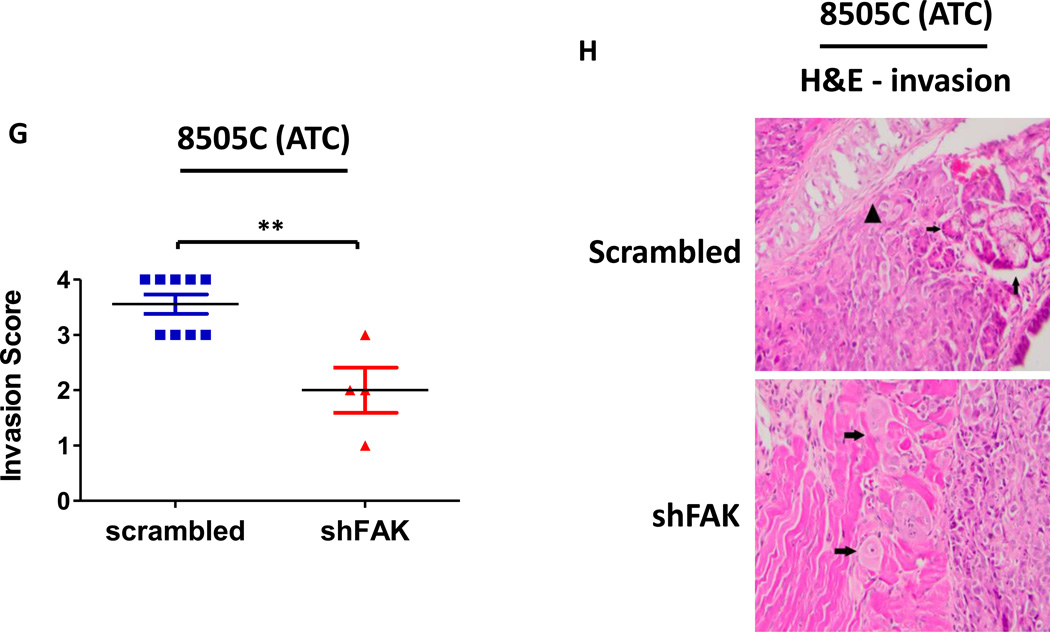
Figure 5. Loss of FAK expression significantly reduces tumor growth in ATC and prevents tumor establishment in PTC orthotopic models.
Mice were injected with BCPAP or 8505C cells expressing either shFAK (shFAK1) or scrambled control shRNA. BCPAP (A) and 8505C (D) tumor growth was monitored overtime via bioluminescence imaging (BCPAP: day 7, p≤0.05; day 21, p≤0.001; day 28, p≤0.01; day 35, p≤0.05; t-test. 8505C: day 7, p≤0.05; day 14, p≤0.001; day 21, p≤0.05; day 28, p≤0.01; t-test). Results shown are mean bioluminescence signal (photons/second) per group ± SEM at the indicated time points. Representative bioluminescence images for BCPAP shFAK and scrambled tumors (B) and 8505C shFAK and scrambled tumors (E) are shown. Tumors were collected upon dissection (BCPAP = day 35; 8505C = day 28) and final tumor volumes for BCPAP (C) and 8505C (F) were calculated (BCPAP: p≤0.05; 8505C: p≤0.0001). (G) H&E staining was performed on sections of 8505C shFAK and scrambled orthotopic thyroid tumors. Invasion was scored and calculated by a pathologist. Results are invasion scores ± SEM (p≤0.0001, t-test). (H) Representative images are shown of H&E staining. H&E of scrambled-expressing tumor shows invasion of poorly differentiated carcinoma into trachea. Small arrows demonstrate salivary gland. Arrowhead demonstrates tracheal cartilage. (Bottom) H&E of shFAK-expressing tumor with arrows demonstrating invasion of tumor cells into adjacent muscle.


