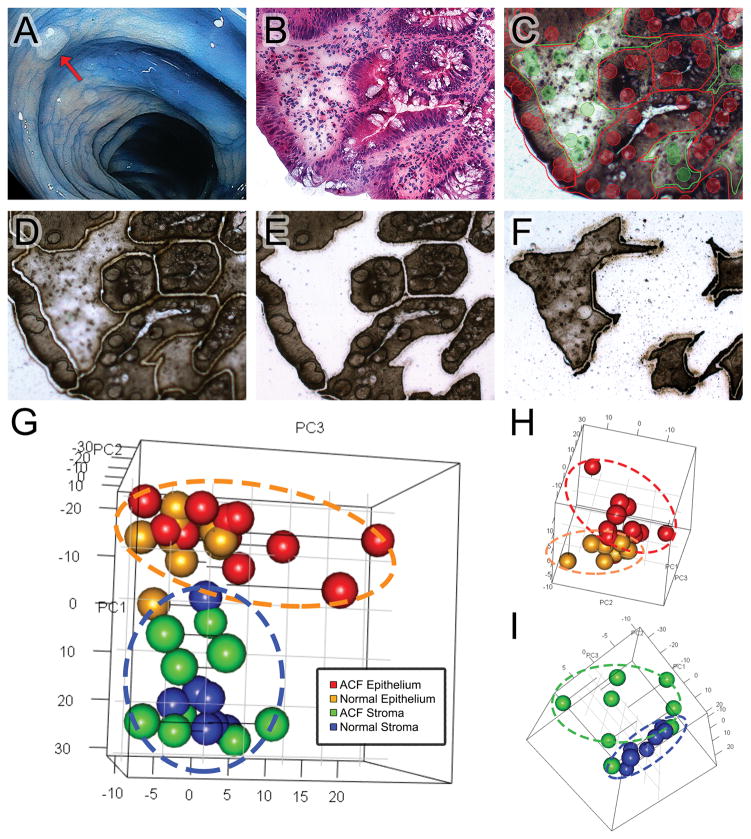
Figure 1. LCM workflow for sample collection and analysis.
(A) A representative ACF identified in the proximal colon of a patient during HD-chromoendoscopy (red arrow), using 0.1% indigo Carmine dye-spray for contrast enhancement. (B) H&E slide of a dysplastic ACF harboring an APC r876* mutation. (C) Unstained PEN serial section of the same sample viewed from the internal camera of the Arcturus XT with slide mark-up indicated. Two capture groups were used: epithelial crypts (red) and the surrounding stroma (green). (D) An ultraviolet laser was used to cut the tissue from the slide and (E) epithelial and (F) stromal cells were captured onto separate caps for downstream RNA isolation, library preparation, and sequencing. (G) 3-D principal component analysis (PCA) of the RNA-seq data that characterizes the trends exhibited by the expression profiles of ACF epithelium (red), matched normal epithelium (orange), ACF- associated stroma (green), and matched normal stroma (blue). Each sample is represented by a single dot. In 3-D plot of epithelial (H) and stromal (I) samples. ACF separate from matched normal.

