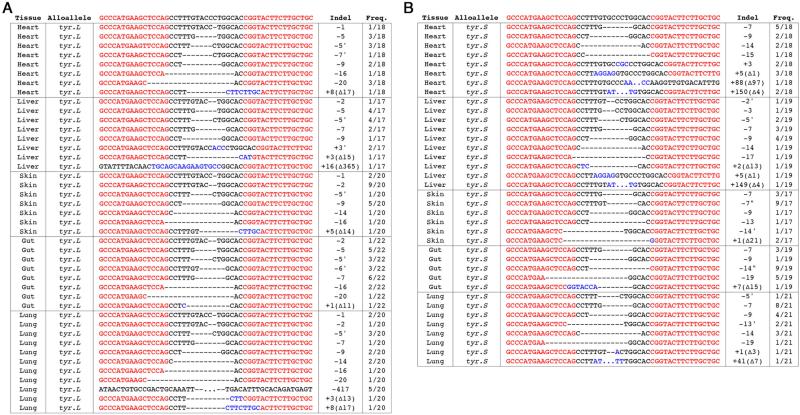
Figure 3.
Genotyping of F0 somatic tissue of female OHT tyr mutant frog. (A) Bar graph illustrating the frequency of tyr.L and tyr.S mutations in F0 organs. Wild type alleles make up the remainder of each column. *Only insertion numbers indicated; details of the deletion are found in panel B. (B) Sequence of mutations identified in heart, liver and skin of F0 female OHT frog. Frequency refers to the number of clones that contained the mutation. Red font indicates TALEN target sites.

