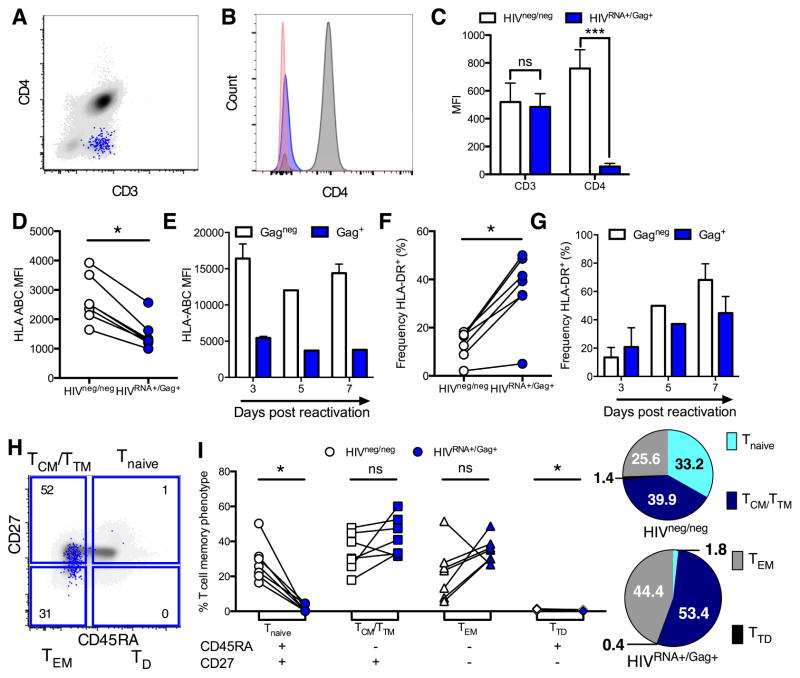
Figure 3. Dissociated expression patterns of CD4 co-receptors and memory phenotype of CD4 cells maintaining ongoing infection in viremic individuals.
Peripheral CD4 from viremic, untreated (UNT) patients were analyzed directly ex vivo without stimulation for phenotype. White symbols/bars represent HIVneg/neg CD4 and blue represents HIVRNA+/Gag+ CD4 from the same patient sample. (A–C) HIVRNA+/Gag+ T cells downregulate CD4. (A) Example plot overlaying HIVRNA+/Gag+ (blue) onto HIVneg/neg (gray) CD4. (B) Histogram of staining in (A) with negative control (red). (C) Quantification of results in (A and B). n=5 UNT. ***p<0.001 by Friedman ANOVA with Dunn’s post-test. (D–G) HLA-ABC expression (D and E) and HLA-DR+ frequency (F and G) on HIV-infected vs uninfected CD4. For D and F infected cells were defined by dual mRNA/protein stain on unstimulated UNT CD4 analyzed directly ex vivo. For E and G infected CD4 were defined by standard Gag protein staining only at time points post-reactivation for an endogenous, spreading infection. (H and I) Comparison of memory phenotype between HIVRNA+/Gag+ CD4 in UNT compared to HIVneg/neg CD4. (H) Example plot and gating with HIVRNA+/Gag+ CD4 (blue) overlaid onto total T cell population (grey). Numbers represent frequency of HIVRNA+/Gag+ CD4 with specific phenotype. (I) Quantification of data in (H). Numbers shown in pie charts represent normalized mean. n=7 UNT, except in (E and G) where n=2. ns signifies p>0.05, *p<0.05 by Wilcoxon signed rank test. See also Figure S5.

