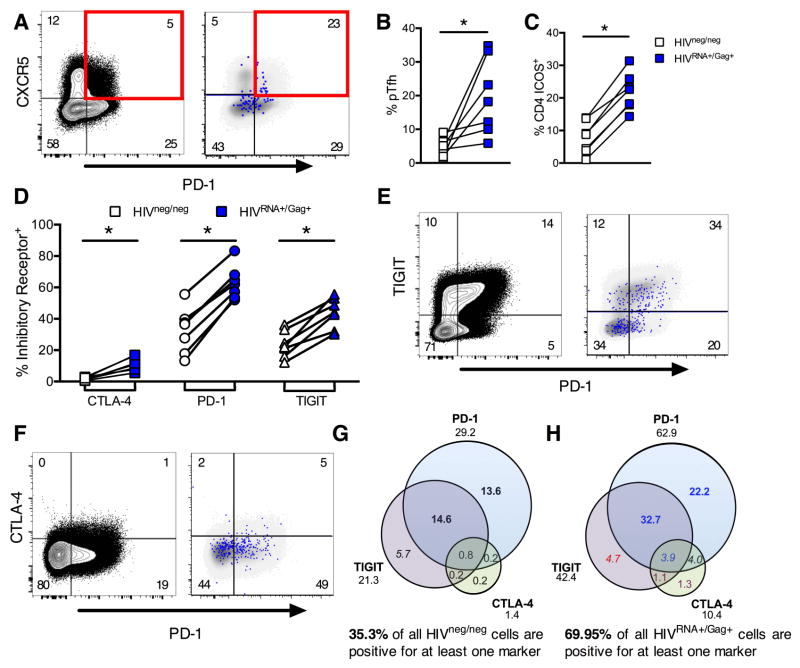
Figure 4. CD4 T cells maintaining ongoing replication during viremia show markers of activation, exhaustion and peripheral T follicular helper cells.
Peripheral CD4 from viremic patients (UNT) were analyzed without stimulation for phenotype directly ex vivo. For example plots in A, E and F, left hand panel shows gating on total CD4 T cells with frequencies of each population indicated. Right hand panel shows HIVRNA+/Gag+ CD4 events in blue, overlaid onto HIVneg/neg events (gray) for the same markers. Frequencies shown represent the HIVRNA+/Gag+ population. (A) Example plots of pTfh phenotype (pre-gated on CD45RA-memory CD4). (B) Quantification of results in (A), shown as frequency of memory CD4. (C) Frequency of ICOS expression on HIVRNA+/Gag+ versus HIVneg/neg CD4. (D) Relative expression of coinhibitory receptors CTLA-4, PD-1 and TIGIT on HIVRNA+/Gag+ compared to HIVneg/neg CD4. (E and F) Example plots of coexpression; TIGIT and PD-1 (E), CTLA-4 and PD-1 (F). (G and H) Boolean analysis of inhibitory receptor coexpression on HIVneg/neg (G) vs HIVRNA+/Gag+ (H) CD4 from the same patients. Numbers under inhibitory receptor name indicate total frequency of positive events (e.g. all PD-1+) and correspond to data in (EF). Red text indicates populations under represented in HIVRNA+Gag+ versus HIVneg/neg. Populations enriched in HIVRNA+Gag+ by 1–5-fold are blue, 5–10 fold (purple) or over 10 fold (black). Populations contributing more than 2 or 10% are in italics or bold respectively. Data represent medians. n=7 UNT. *p<0.05 by Wilcoxon signed rank test. See also Figure S5.

