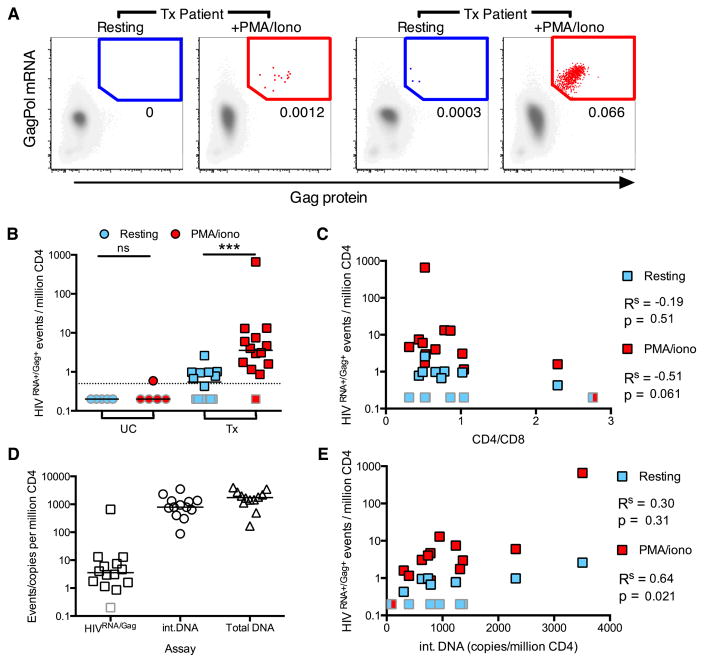
Figure 5. Detection of latently HIV-infected CD4 T cells from ART-treated patients.
Peripheral HIVRNA+Gag+ CD4 were detected in treated, aviremic patients (Tx) directly ex vivo (resting, light blue), or following stimulation (PMA/iono, red). (A) Example plots of a representative patient (left) or a patient with a large inducible reservoir (right). (B) Quantification of data in (A) for Tx and uninfected controls (UC). Dotted line represents limit of detection (LOD). ns signifies p>0.05, ***p<0.001 by Wilcoxon signed rank test. (C) Correlation between reactivation and CD4/CD8 T cell ratio. Where result is the same between two conditions, a split box is shown. (D) Comparison of reservoir measured by different techniques; HIVRNA/Gag assay (with PMA/iono stimulation, data as in (B)), integrated HIV DNA PCR (int.DNA) and total HIV DNA PCR. Line shown at median. (E) Correlation between reservoir as measured by integrated DNA and HIVRNA/Gag assays. Gray bordered symbols are below LOD. In all experiments, n=5 UC and 14 Tx (13 for Figure 5D and E). Statistics shown are Spearman’s correlation coefficient (Rs) with associated p values. See also Figure S6 and Tables S3 and S4.

