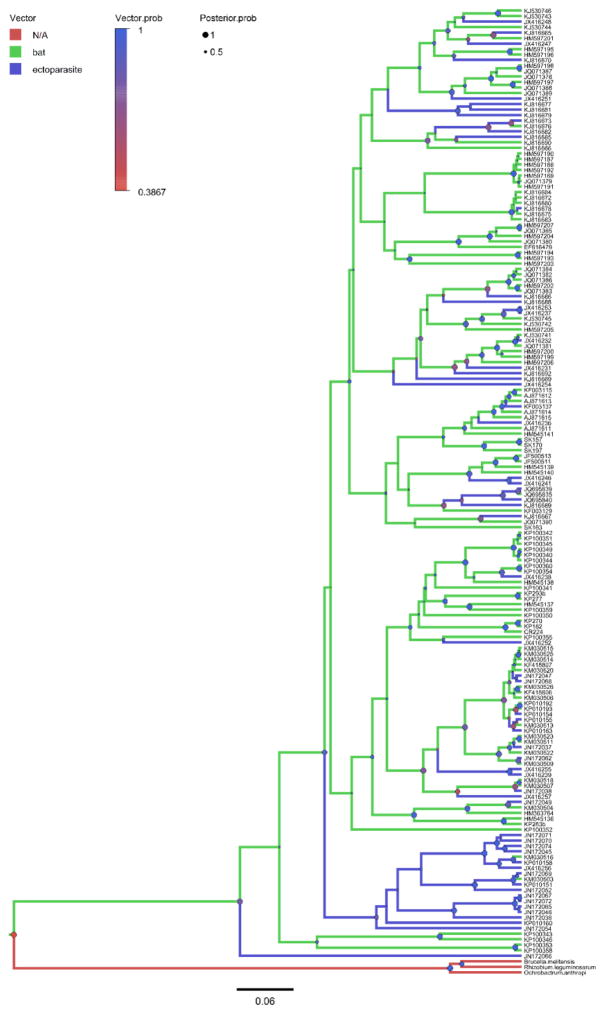
Fig. 4.
Bayesian phylogeny of Bartonella genotypes reconstructing bat host or arthropod vector associations, shown by colored branches. Posterior probabilities for nodes are shown as circles (●) scaled by size from 0 to 1 (Posterior.prob) and colored by the support for the bat host geographic region at that node (Vector.prob). Mean tree likelihood = −9981.92, ESS = 2713; mean vector tree likelihood = −131.17, ESS = 5741. Details on tip labels for Bartonella genotypes and associated host species are listed in Table S1 and S2.

