Fig. 4.

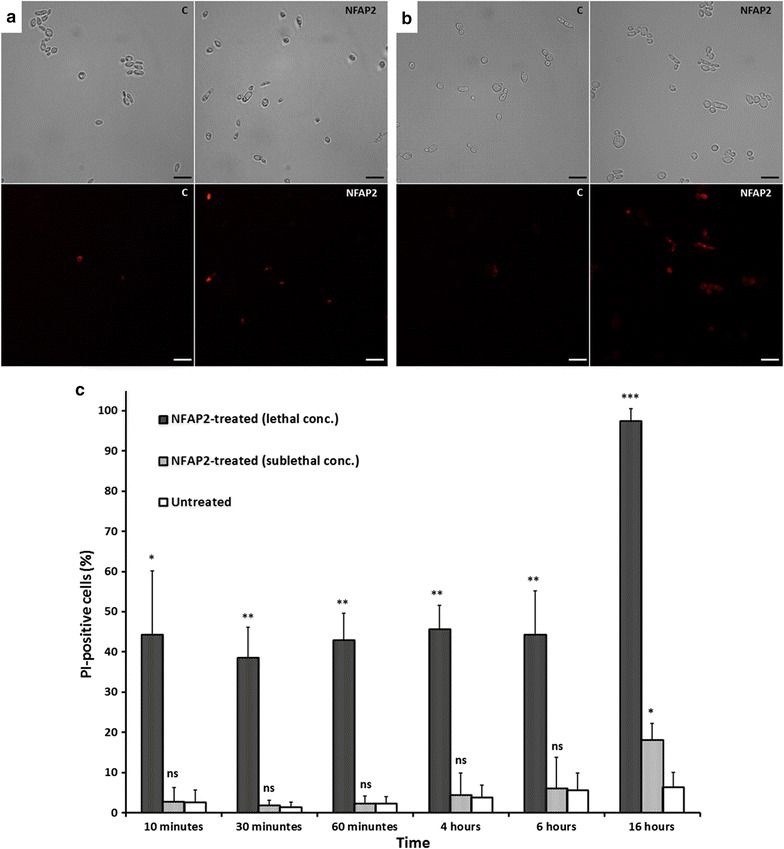
Propidium iodide (PI) staining of S. cerevisiae cells after sublethal (0.089 µg ml−1) NFAP2 treatment for 16 h at 30 °C (a) and lethal (0.195 µg ml−1) NFAP2 treatment for 10 min at 30 °C (b). Intracellular red fluorescence indicates membrane disruption. c Untreated control, NFAP2: NFAP2-treated cells. Scale bars represent 20 μm. Proportion of the PI-positive S. cerevisiae cells in the sublethal and lethal NFAP2-treated and untreated samples after different incubation times at 30 °C (c). Significant differences (p-values) were determined based on the comparison with the untreated control. ***p < 0.0001, **p < 0.005, *p < 0.05, ns no significant difference
