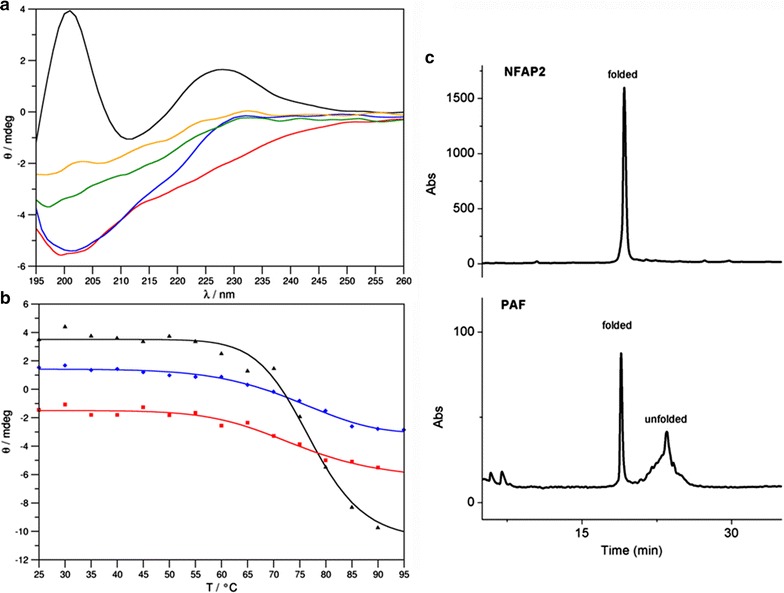
Fig. 5.

ECD spectra of NFAP2 recorded at 25 °C (black), 95 °C (red), and again at 25 °C immediately (blue), 72 h (green) and 4 weeks (orange) after heat treatment (a). Thermal unfolding curves of NFAP measured at 200 nm (black, R2 = 0.9899, Tm = 76.60 °C), 212 nm (red, R2 = 0.9770, Tm = 72.49 °C) and 228 nm (blue, R2 = 0.9910, Tm = 74.00 °C) (b). RP-HPLC chromatogram of NFAP2 and its comparison with folded and unfolded PAF (c)
