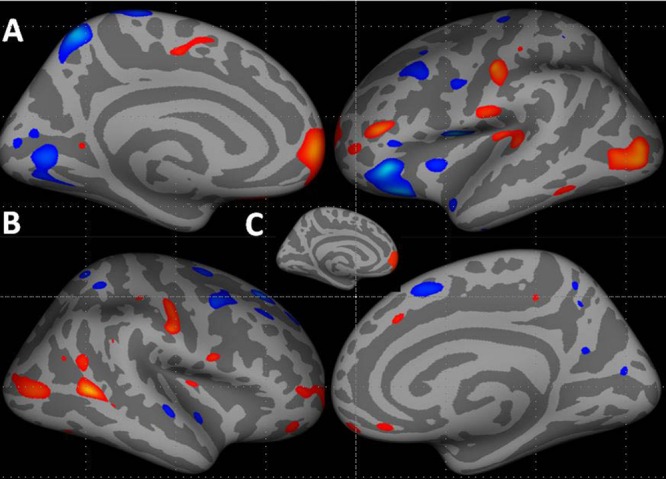
FIGURE 1.

Increase in cortical thickness (warm colors) in the left hemisphere (A – medial and lateral surfaces) and right hemisphere (B – lateral and medial surfaces) in patients compared to healthy controls. All vertices with threshold between 0.01 < p < 0.0001, uncorrected, shown for display purposes. (C) Inset shows the cluster in the left hemisphere superior frontal region that survived correction for multiple comparisons, p < 0.05. Blue–cyan represents cortical thinning; red represents cortical thickening.
