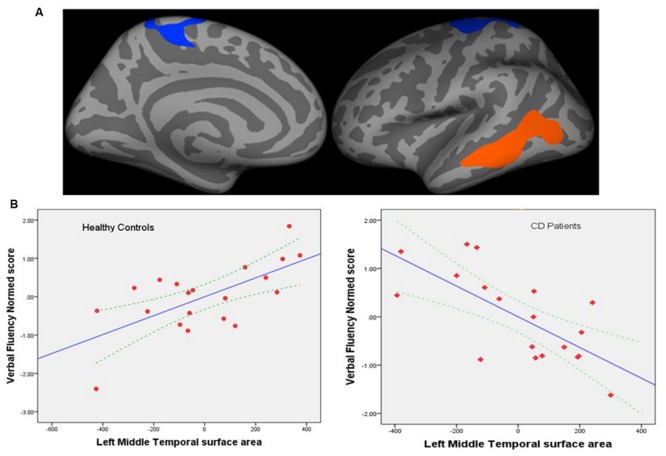
FIGURE 3.

(A) Regional cortical surface areas showing significant group differences in the correlation between the left cortical surface area and normed verbal fluency scores. Left precentral (p = 0.008) and middle temporal regions (p = 0.002) showed significant effects (corrected for multiple comparisons). Blue-cyan represents negative association; red represents positive association. (B) Graphs showing correlation between cortical surface area (mm2) for the left middle temporal region and verbal fluency performance for controls (left) and patients (right). Dotted lines represent 95% confidence interval (CI) for the mean. The left middle temporal surface area was the most significant predictor of performance with standardized coefficient β = 0.90, p = 0.005; left precentral area only showed a trend toward significance with β = -0.496, p = 0.09 and is therefore not shown here.
