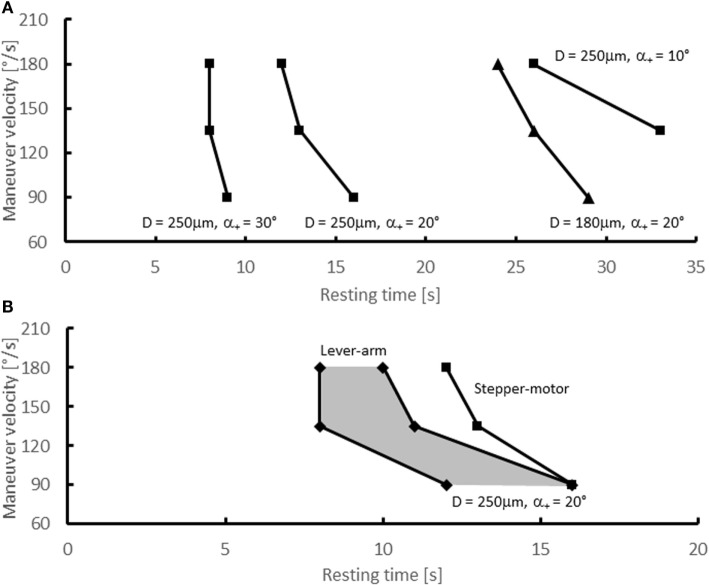
Figure 5.
Experimental results – critical resting times. Critical resting times as function of the maneuver velocity for various experimental configurations. (A) Stepper-motor experiments with D = 250 μm (•) and α+ = 10°, 20°, 30° and with D = 180 μm (▴) and α+ = 20°; (B) lever-arm experiments (■) with D = 250 μm and α+ = 20°. The shaded area indicates the range of resting times for which the lever-arm experiments did not yield conclusive results. For comparison, the critical resting times from the stepper-motor experiments for D = 250 μm (•) and α+ = 20°are shown as well [identical to data shown in (A)].

