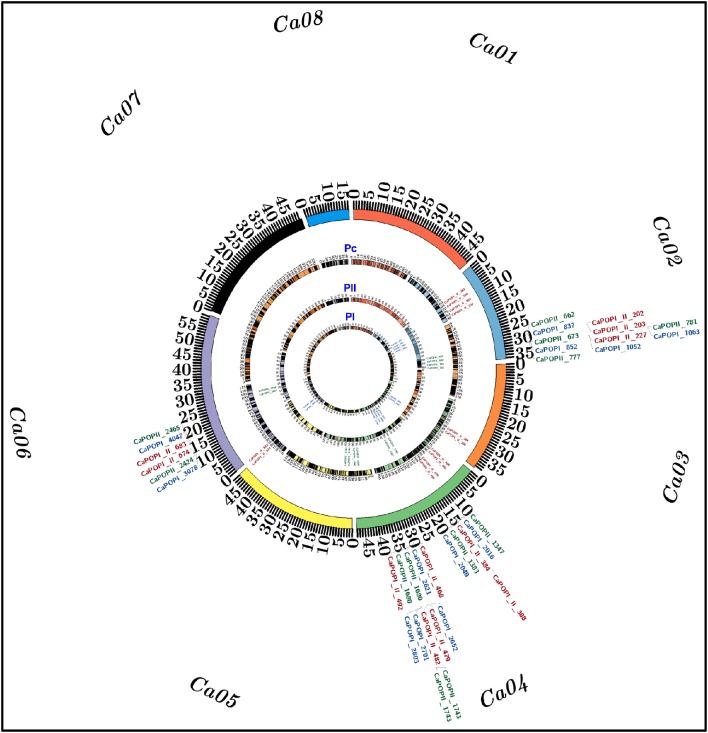
Figure 4.
The identified three of each major PN and SYP QTLs mapped on chromosomes 2, 4, and 6 of two high-density 1059 and 594 InDel markers-anchored inter-specific genetic linkage maps (PI: Pusa 1103 × ILWC 46) and (PII: Pusa 256 × ILWC 46) and a consensus 1479 InDel markers-led high-resolution genetic map (Pc) of chickpea, are illustrated by the Circos circular ideograms (PI, PII, and Pc). The circles represent the different genetic map length (cM) (spanning 5–10 cM uniform genetic distance intervals between bins) of eight LGs/chromosomes coded with multiple colors. The integration of a consensus genetic map (Pc) with physical map at the identified three of each major PN and SYP QTLs scaled-down the long genomic regions harboring these major QTLs into short PN and SYP robust QTL physical intervals (indicated with red color InDel markers) mapped on kabuli chromosomes 2, 4, and 6. The InDel markers flanking the six major PN and SYP QTLs mapped on chromosomes 2, 4, and 6 of high-resolution genetic maps—PI, PII, and Pc are highlighted with blue, green, and red color, respectively. The detail information on QTLs and InDel markers are provided in the Table 2. The outermost circles denote the various physical sizes (Mb) of eight chromosomes coded with multiple colors as per the pseudomolecule sizes documented in kabuli chickpea genome (Varshney et al., 2013).

