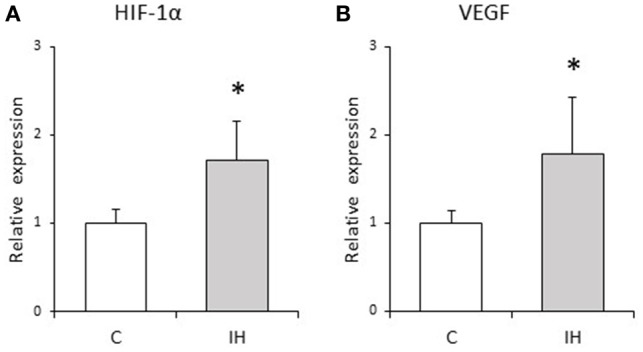
Figure 4.

Relative expression levels of osteogenesis–angiogenesis coupling markers. Relative HIF-1α (A) and VEGF (B) expression in the PDL tissues was compared between the C and IH rat groups by RT-qPCR. The mRNA-expression levels measured in C rats were set to a value of 1. Data are shown as the mean ± standard deviation for each group. *p < 0.05 by the Mann–Whitney U-test.
