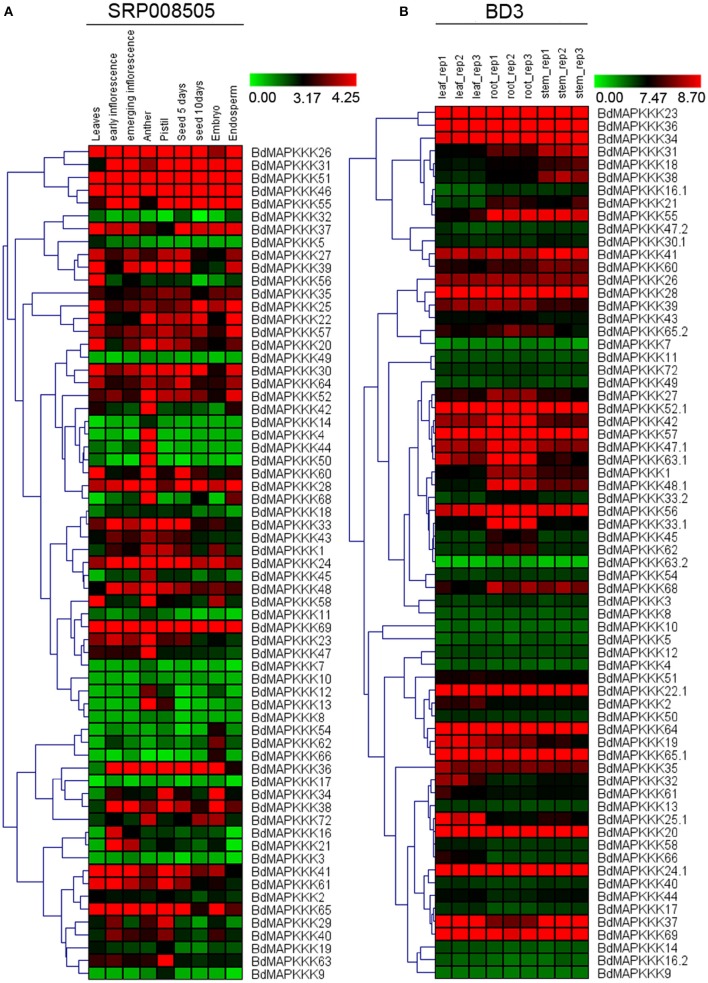
Figure 6.
The expression profile of BdMAPKKK genes in different tissues and organs. The red and green shading represents the relative high or low expression levels, respectively. (A) The expression pattern of BdMAPKKK in different development stages and organs. The color bar represents the original expression value plus1 and then make a log2. (B) The expression pattern of BdMAPKKK in leaf, root and stem. The color bar represents log2 expression value.

