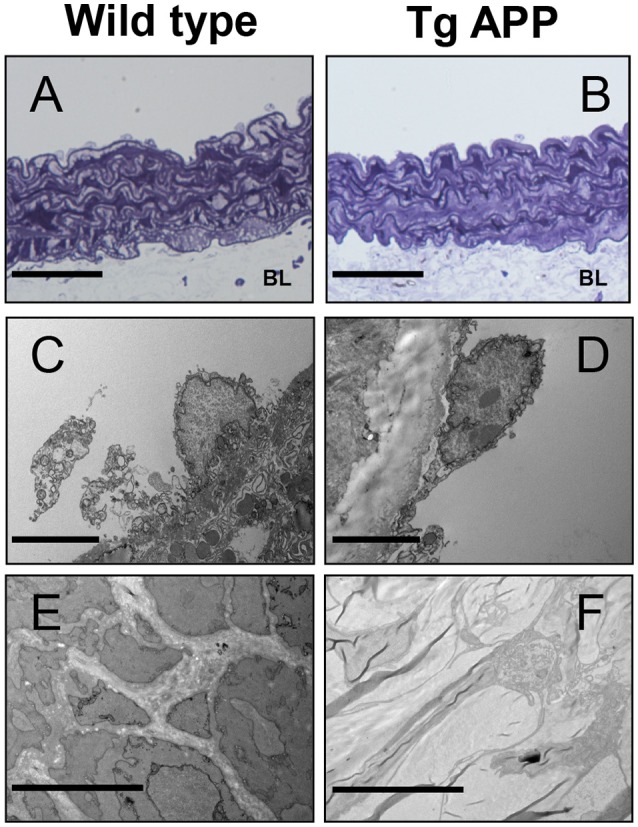
Figure 6.

Electron micrographs of wild type and Tg APP mice. Representative images are shown for wt (A,C,E) and Tg APP mice aortae (B,D,F). (A,B) toluidine blue micrographs showing similar structure (n = 20 animals/per group). BL: basal lamina, (C,D) endothelial cells show similar appearance (wt n = 4, Tg APP n = 6). (E) smooth muscle cells surrounded by collagen in wt mice aorta, (F) muscle cells are embedded in collagen in Tg APP aorta (wt n = 4, Tg APP n = 6). Scale bars, 50 μm in (A,B); 100 nm in (C–F).
