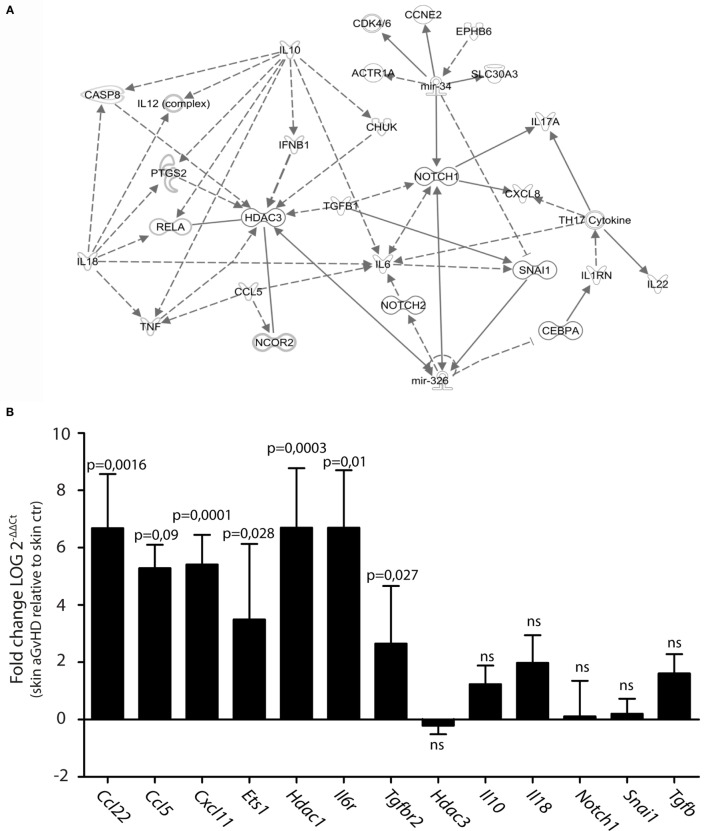
Figure 2.
Prediction of mRNA targets by Ingenuity Pathway Analysis. (A) A network of possible mRNA targets and affected biological pathways for miR-34b and miR-326 was constructed using QIAGEN’s IPA software. Dashed lines represent indirect interactions, while solid lines indicate direct interactions. (B) mRNA expression analysis by qRT-PCR analysis in skin samples from controls (n = 6) or aGvHD rats (n = 6). Samples were normalized to an endogenous control (B2m) and expression levels reported as log of 2−ΔΔCt ± SD. Significance was calculated using the Student’s t-test (two-tailed) with Welch’s correction.

