
Figure 3.
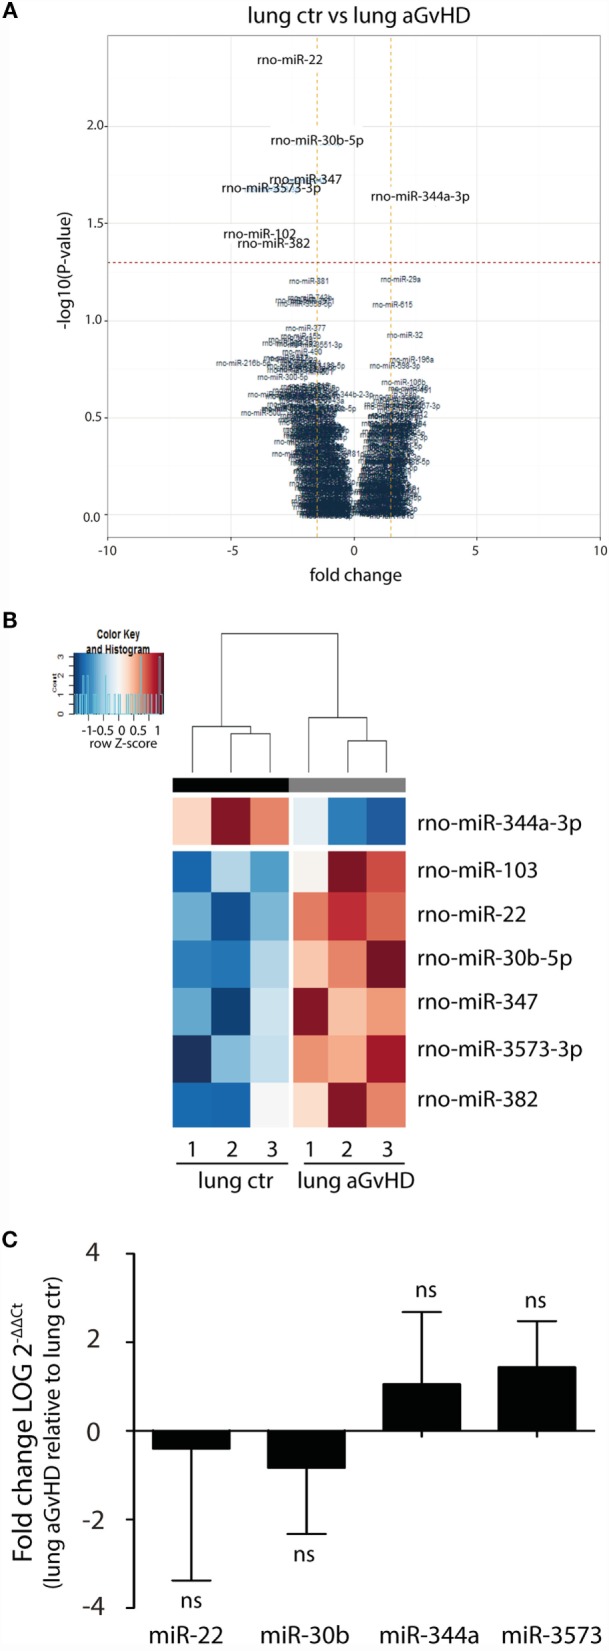
miRNA expression signature in lung during aGvHD. (A) Volcano plot showing the relationship between fold change and significance between the two groups. The horizontal dashed line indicates cutoff for significance p < 0.05 (−log10 p-value >1.3) and the vertical lines for fold change ≥1.5/≤−1.5. (B) Heatmap showing unsupervised hierarchical clustering of differentially expressed miRNAs in lung between control (n = 3) and aGvHD (n = 3) animals. Each column represents an individual rat. Relative fold change is indicated by the color scale (red: high; blue: low). (C) qRT-PCR analysis of miRNA expression in lung of control (n = 6) or aGvHD (n = 6) rats. Samples were normalized to endogenous controls and expression levels reported as log of 2−ΔΔCt ± SD. Significance was calculated using the Student’s t-test (two-tailed) with Welch’s correction.