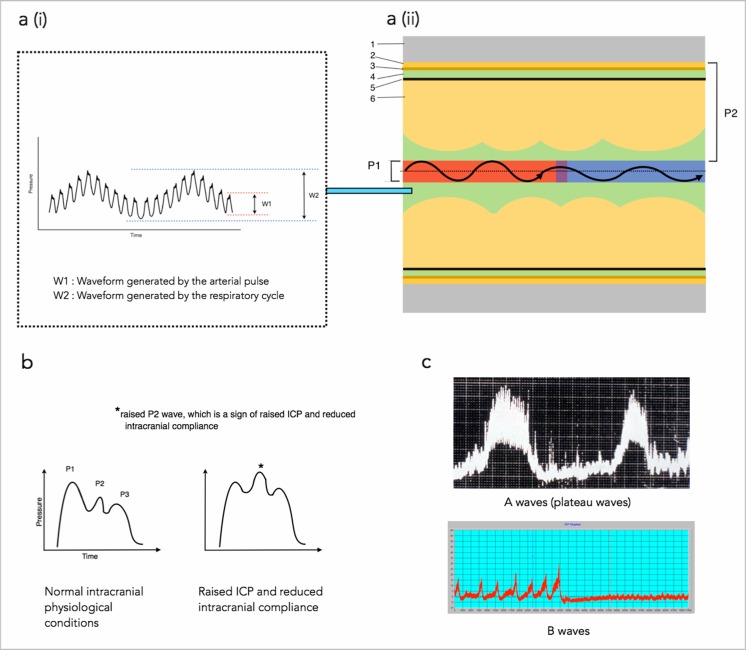
Fig. 1.
An illustration of the ICP waveform components. a (i) The ICP waveform showing the cardiac component (W1) and respiratory component (W2). The cardiac component consists of three peaks: P1 (reflects arterial pulsation), P2 (reflects, to a degree, intracranial compliance) and P3 (reflects aortic valve closure). The respiratory component reflects the cerebral venous pulsation generated by the changes in intra-thoracic pressure that is generated by respiration. a (ii) An illustration of what the individual ICP wave form peaks represent in terms of intracranial physiology. The black oscillating arrow represents arterial pulsations (red area), which subsequently become venous pulsations (blue area) as cerebral blood travels through the cerebral vasculature. P1 is the pressure generated in the CSF as a result of the pressure generated from the arterial pulsation. P2 is the pressure generated within the CSF as a result of the forces generated from both the pulsatile blood vessel and the resistance from the intracranial tissue. The higher the resistance is, the greater the pressure within the CSF and therefore the greater the P2 wave amplitude. Note the intracranial compliance, and therefore the value of P2, can be affected by any factor from the endothelium of the cerebral blood vessel to the intracranial surface of the skull (represented by P2) Diagram key: 1, skull; 2, dura layer; 3, arachnoid layer; 4, subarachnoid space containing the cerebrospinal fluid (represented in green); 5, pia layer; 6, cerebral tissue. b The individual ICP waveform peaks. Under the normal intracranial physiological state, P1 > P2 > P3. However when ICP is raised, and there is reduced intracranial compliance, P1 < P2 > P3. c The slow vasogenic waves of ICP, secondary to autoregulation-derived cyclic fluctuations of arterial blood volume. A waves, or plateau waves, always indicate pathology and signify reduced intracranial compliance. Once they are present, the patient will likely have neurological deterioration. They involve a steep rise in ICP from around a normal value to 50 mmHg or more. They persist for 5-20 min after which there is a sharp decline. B waves are more subtle than A waves and can indicate several abnormalities of intracranial homeostasis including being an indicator of failing intracranial compensation. It is important to note however that they can also be present in patients with normal ICP. B waves are rhythmic oscillations with ICP rising in a crescendo manner to levels 20–30 mmHg higher than baseline, with a subsequent sharp decline. They occur every 1–2 min. Note, Lundberg A waves and B waves refer to raises in static (mean ICP) and are not related to the pressure fluctuations during the cardiac cycle, which is the case for ICP wave amplitudes

