
Fig. 2.
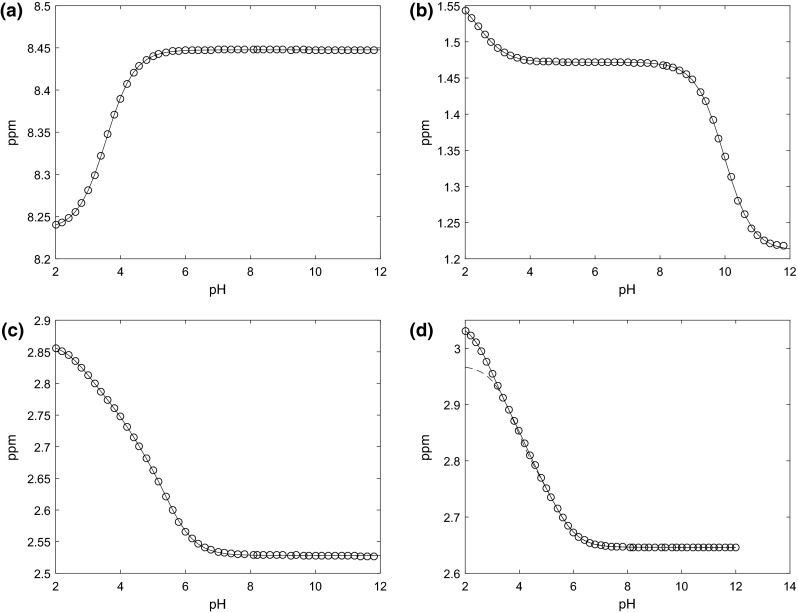
Measured chemical shift changes (open circle) for Formate (a), Alanine (b) and Citrate (c) peaks are shown with non-linear fits to the one, two and three protonation site forms of Eq. (2), respectively (line). A second Citrate peak (d) is shown with a nonlinear fit to the three protonation site form of Eq. (2) (dotted line) versus the four protonation site form of Eq. (2) (line)