
Fig. 1.
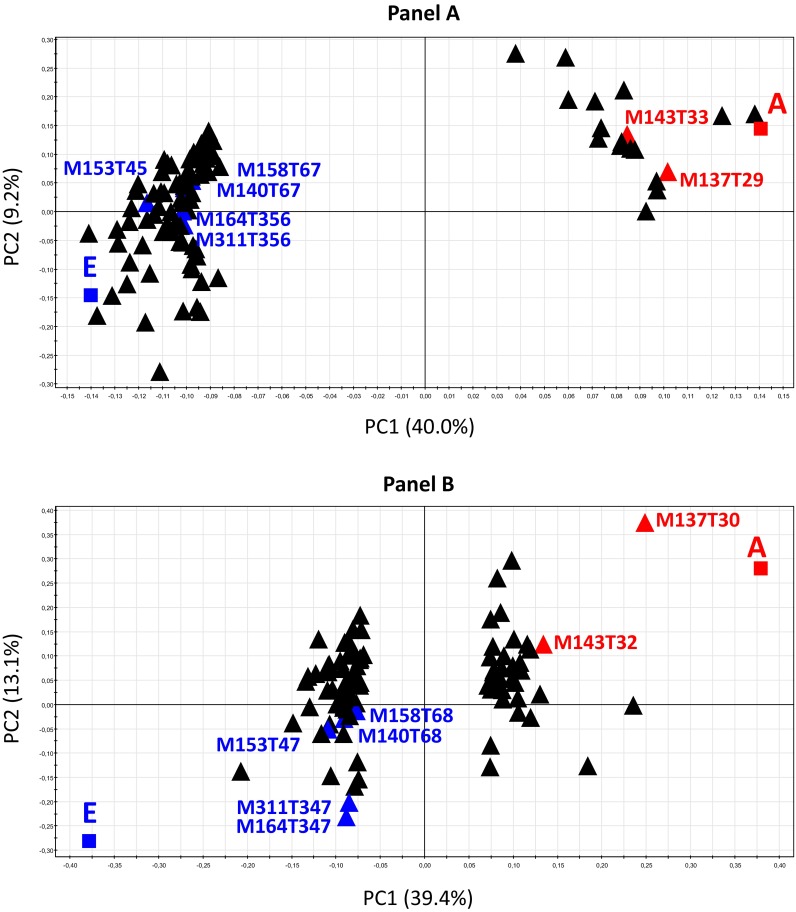
Comparison between the present and a previous cohort. Discriminations were performed between the control rats (A group) and the rats contaminated at the dose 40 mg L−1 for 9 months (E group). Loading scatter plots from the partial least-square discriminant analysis (PLS-DA) were based on the 95 most discriminant features. a Present cohort; variable selection was performed on the preprocessed and filtered matrix (1718 variables; VIP scores >2.4). b Cohort from Grison et al. (2013); variable selection was performed on the preprocessed and filtered matrix (1376 variables; VIP scores >1.8)