
Fig. 2.
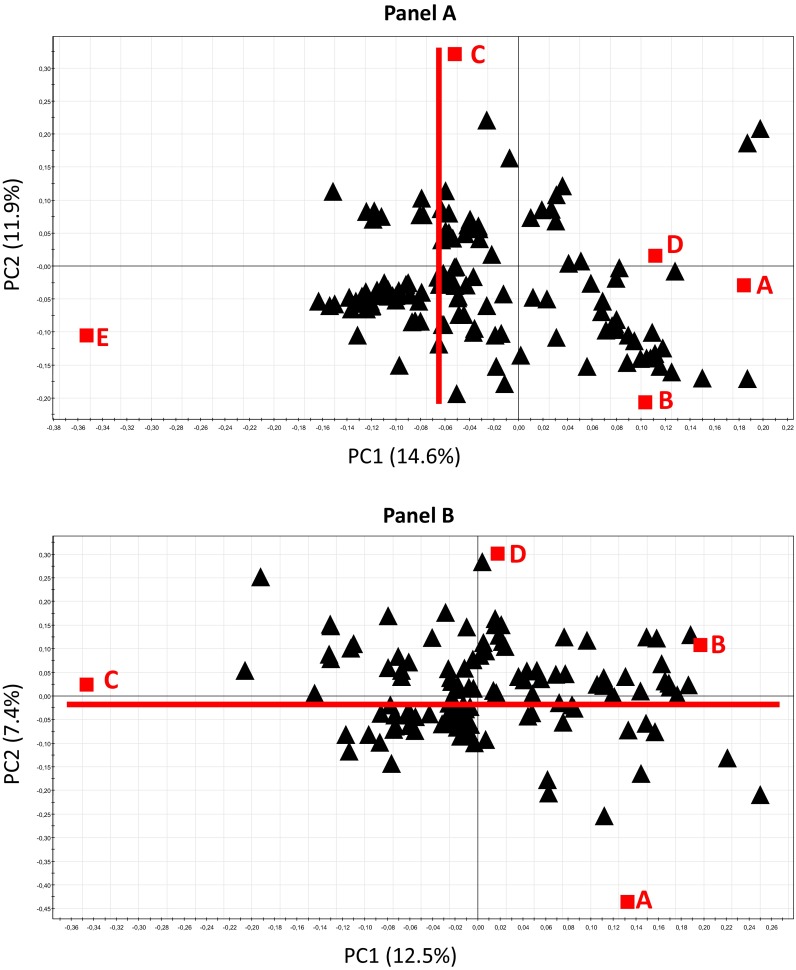
Partial least-square discriminant analysis (PLS-DA) performed on the “dose matrix” after feature selection (126 variables); classes were: A,control; B contamination dose of 0.015 mg L−1; C 0.15 mg L−1; D 1.5 mg L−1; E 40 mg L−1. a Loading scatter plot from the model built on all experimental doses. b Loading scatter plot from the model built on all experimental doses but the E one