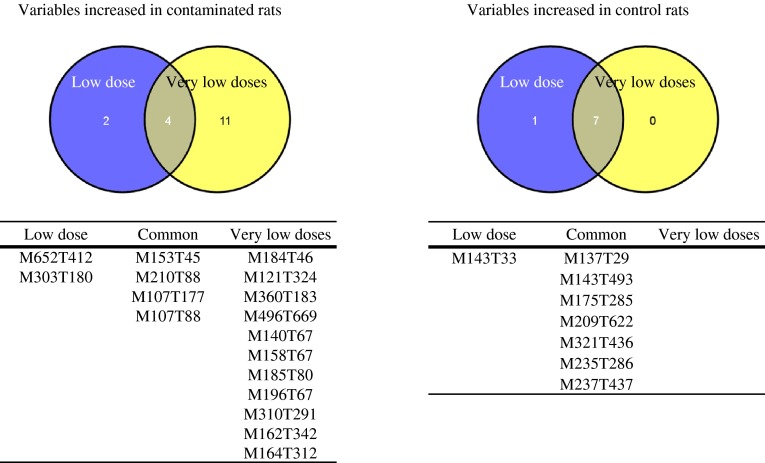
Fig. 3.
Selection of the most robust features associated with low- and very low-dose exposure to natural uranium. Using Venn diagrams, the 14 features associated to the E-dose contamination whatever the duration of the contamination (“Low dose” group) were compared to the 22 features associated to any of the other doses of contamination (B, C and D) when pooling all time points together (“Very low dose” group)

