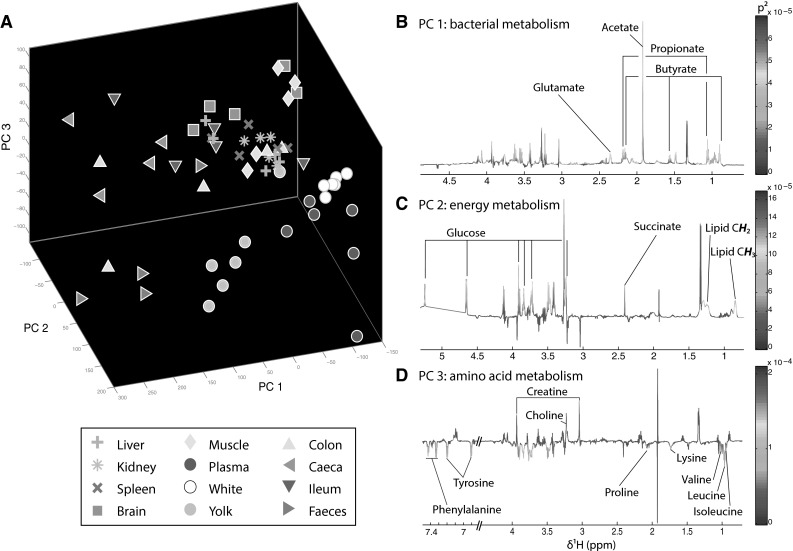
Fig. 5.

Metabolic variability between the twelve described chicken matrices. a 3-Dimentional PCA score plot derived from the 1H-NMR spectra of liver, kidney, spleen, brain, muscle, plasma, white, yolk, colon, caecum, ileum and faeces of six animals. b PCA loadings representing the metabolic variations on PC1. c PCA loadings representing the metabolic variations on PC2. d PCA loadings representing the metabolic variations on PC3
