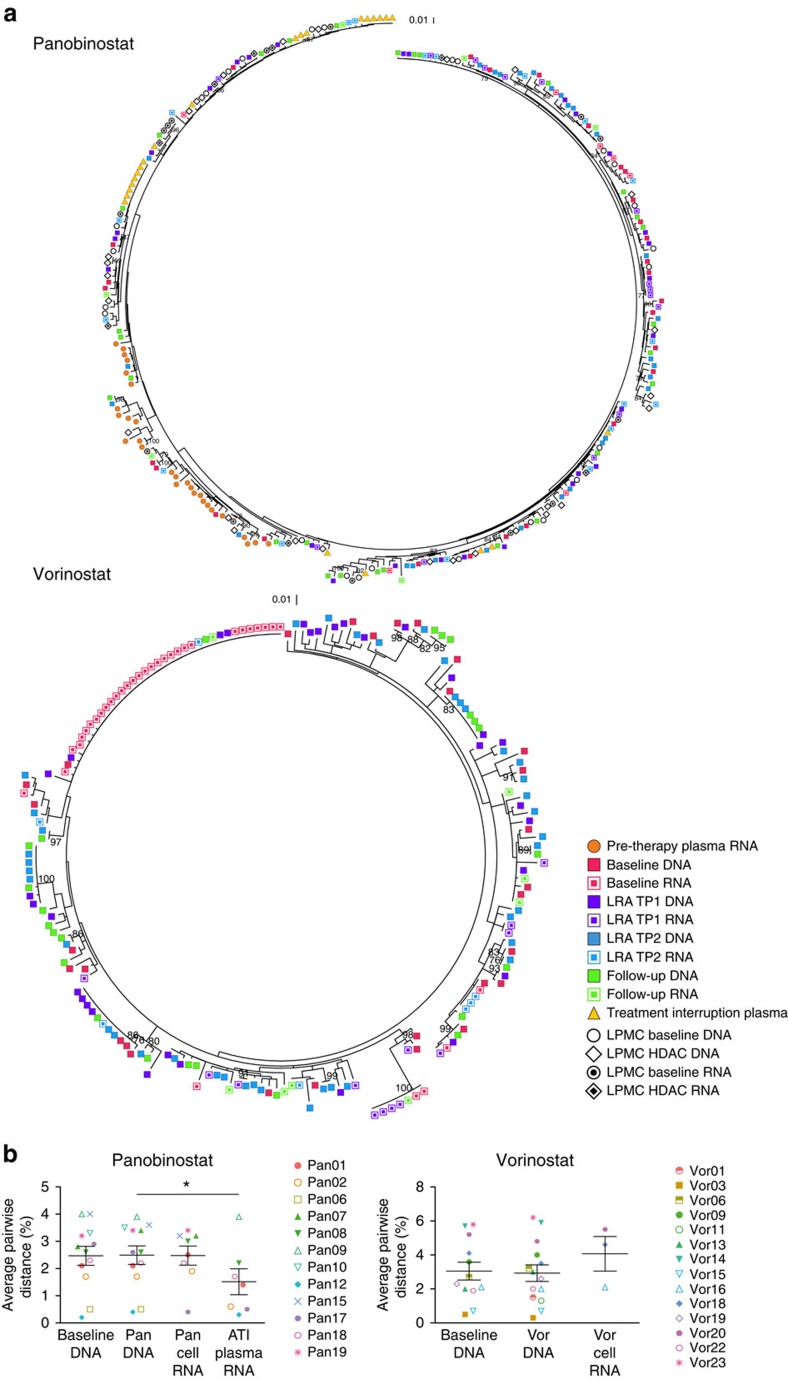
Figure 1. Panobinostat and vorinostat non-selectively activate transcription from latent HIV-1 proviruses.
(a) Representative phylogenetic trees of HIV-1 sequences from HIV-infected participants on suppressive ART who received panobinostat (Pan18) or vorinostat (Vor16) showing the genetic relationship of sequences from each time point. For participant Pan18, the plasma samples were collected ∼1 year and 6 months before initiation of antiretroviral therapy and 14 days following the analytical treatment interruption. Peripheral blood samples were collected at baseline, 2 h after the first dose of panobinostat (TP1), 32 days after the first dose of panobinostat (TP2) and 38 days after the final panobinostat dose. Intestinal lamina propria mononuclear cells were collected at baseline (1 week before the first panobinostat dose) and during week 4 of the panobinostat trial. For participant Vor16, peripheral blood samples were collected at baseline, 7 days after the first dose of vorinostat (TP1), 14 days after the first dose of vorinostat (TP2) and 7 days after the final vorinostat dose. (b) Average pairwise distance of cell-associated DNA (Pan n=12, Vor n=12) before and DNA (Pan n=12, Vor n=14) and cell-associated RNA (Pan n= 8, Vor n=3) during vorinostat and panobinostat administration, as well as the plasma HIV-1 RNA following an ATI for the panobinostat trial (n=7). Each data point represents the group mean±s.e.m. The Wilcoxon signed rank test was used to generate the P values. *P≤0.05.

