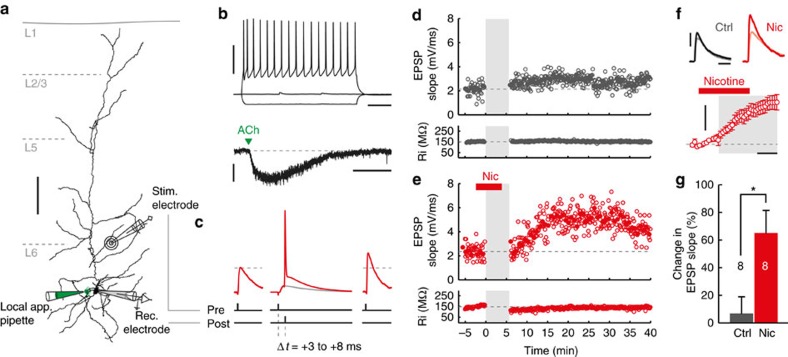
Figure 1. Nicotine facilitates tLTP in L6 pyramidal neurons.
(a) Biocytin reconstruction of layer 6 pyramidal neuron from coronal slice of mouse prelimbic mPFC showing relative positions of recording and stimulating electrodes, and local application pipette. Scale bar, 100 μm. (b) Voltage responses to hyperpolarizing (−120 pA) and depolarizing (+330 pA) somatic current injections (top traces) and current response to local application of acetylcholine (1 mM, 10 ms, bottom trace) to soma of neuron in a. Top scale bars, 40 mV, 100 ms; bottom scale bars, 50 pA, 1 s. (c) Plasticity induction protocol. EPSPs were evoked by extracellular stimulation 100–150 μm from soma along the apical dendrite (a). After obtaining a baseline measure of EPSP (left trace), tLTP was induced by repeatedly pairing EPSPs to APs (middle traces; +3 to 8 ms delay, 50 repetitions). EPSPs were then recorded for up to 30 min. to observe changes in EPSP slope (right trace). (d) Example of a tLTP experiment in control conditions showing slope and input resistance (top and bottom panels, respectively) versus time. Grey shading indicates time of EPSP+AP pairing. Open grey circle=single EPSP, grey circle=mean of 7 EPSPs. (e) As d, for a tLTP experiment where nicotine (300 nM) was bath-applied during pairing (red bar). 
 open red circle=single EPSP, red circle=mean of 7 EPSPs. (f) Top: Example EPSP waveforms recorded during baseline (light color) and 20–25 min. after pairing (dark color), for control and nicotine tLTP experiments shown in (d,e), respectively (scale bars, 3 mV, 30 ms). Bottom: membrane potential change relative to baseline over the course of pairing (grey shading) for STDP experiments where nicotine was applied during pairing (n=8 cells (five animals), mean±s.e.m. in 14 s bins). Scale bars, 5 mV, 2 min. (g) Summary bar chart of control and nicotine tLTP experiments, showing percentage change in EPSP slope for both conditions (mean±s.e.m.; control: n=8 (seven animals), nicotine: n=8 (five animals) one-way ANOVA: F(1,15)=7.242, P=0.017).

