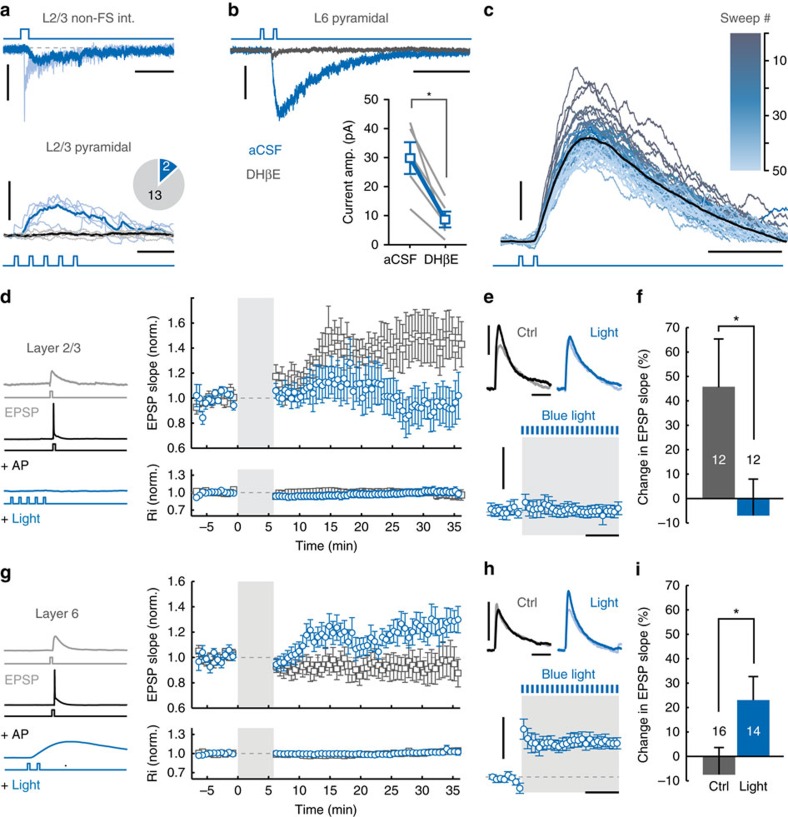
Figure 2. Endogenous Ach oppositely regulates STDP in superficial and deep neocortical layers.
(a) Top: nAChR currents in L2/3 non-FS interneurons following activation of cholinergic fibers with blue light (470 nm, 100 ms). Scale bars, 20 pA, 500 ms. Bottom: Same, but in L2/3 pyramidal neurons (470 nm, 10 ms, 25 Hz). 2 of 15 neurons showed light-evoked potentials (blue traces; light: single trial, dark: average of 5 trials). Scale bars, 3 mV, 100 ms. (b) Light-evoked nAChR-mediated currents in L6 pyramidal neuron (470 nm, 10 ms, 25 Hz) in aCSF (blue trace), or with DHβE (10 μM, grey trace) in Chat-ChR2(N6) and Chat-Cre/Ai32 mice. Right: summary of amplitudes in aCSF and with DHβE (n=5 (two animals), paired t-test, P=0.009). Scale bars, 20 pA, 200 ms. (c) Light-evoked nAChR-EPSPs in Chat-ChR2(N6) L6 pyramidal neurons (10 ms, 25 Hz), 50 times at 0.14 Hz. Mean nAChR-EPSP in black. Scale bars, 3 mV, 200 ms. (d) tLTP induction in L2/3 pyramidal neurons. Left: schematics of pairing and relative timing. Right: Summary of EPSP slope and input resistance for tLTP experiments (control open grey square, light-evoked ACh release open blue circle, mean±s.e.m. of 30 s bins). (e) Top: EPSP waveforms during baseline (light) and 20–25 min after pairing (dark), with and without light-evoked ACh release in L2/3 pyramidal neurons. Scale bars, 3 mV, 30 ms. Bottom: Vm at onset of EPSP during pairing period (grey shading), relative to baseline (n=12 (seven animals), mean±s.e.m., 14 s bins). Scale bars, 5 mV, 2 min. (f) Summary of control tLTP and with light-evoked endogenous ACh release in L2/3 pyramidal neurons (mean±s.e.m.). EPSP+AP pairing with light (n=12 (seven animals)): −7.0±14.9%; EPSP+AP pairing without light (n=12 (eight animals)): +45.8±19.6%. Independent samples t-test: P=0.044. (g) As d, for L6 pyramidal neurons. (h) As e, for L6 pyramidal neurons. (i) As f, for L6 pyramidal neurons. EPSP+AP pairing with light (n=14 (twelve animals)): Median=+27%, IQR=43%; EPSP+AP pairing without light (n= 16 (ten animals)): Median=−20%, IQR=60%. Independent samples Mann-Whitney U-test: U(30)=165, P=0.028.

