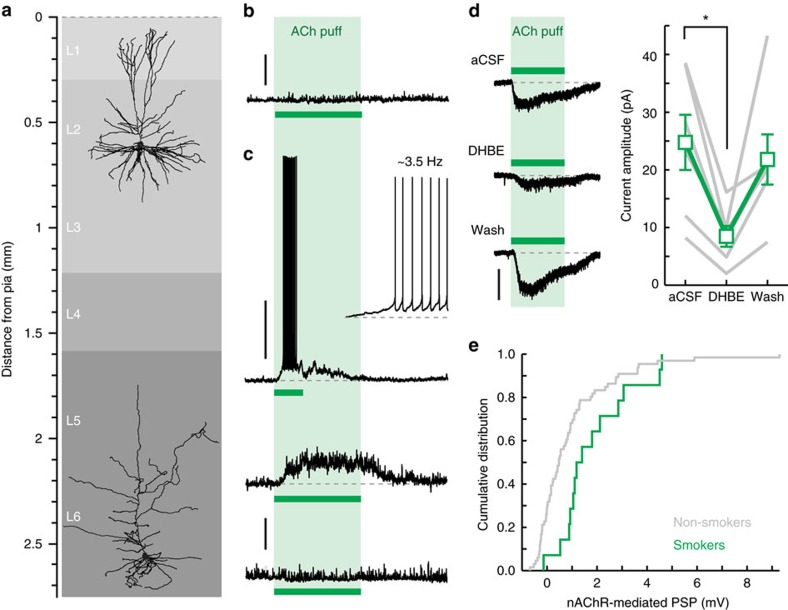
Figure 6. Functional nAChR distribution in human frontal and temporal cortex.
(a) Example reconstructions of biocytin-labelled human L2/3 and L6 pyramidal neurons (obtained from two different patients). (b) Example of the voltage response of human L2/3 pyramidal neuron to local application of ACh (1 mM, 30 s; green bar). Scale bar, 3 mV. (c) Examples of voltage responses obtained from different human L6 pyramidal neurons to a local application of ACh. Top inset: magnification of initial segment of AP-firing response. Scale bar, 30 mV (top trace) and 3 mV (middle and bottom trace). (d) Pharmacology of human ACh-induced currents. Left traces: current responses to local ACh application recorded from one neuron in aCSF (top trace), in presence of DHβE (middle trace), and after >15 min. wash-out of DHβE (bottom trace). Scale bar, 40 pA. Right panel: amplitude of ACh-induced inward currents in control aCSF, in presence of DHβE, and after wash-out, for individual experiments (grey) and sample mean (green, mean±s.e.m.). Repeated-measures ANOVA: F(2,10)=6.675, P=0.014; n=6 (two patients). (e) Cumulative distribution of nAChR-mediated postsynaptic potential (PSP) amplitudes recorded in L6 pyramidal neurons of smoking patients (green; n=14 (three patients)) and non-smoking patients (grey; n=67 (seventeen patients)). Note the shift to higher response amplitudes in brains of smokers, consistent with increased surface expression of nAChRs.

