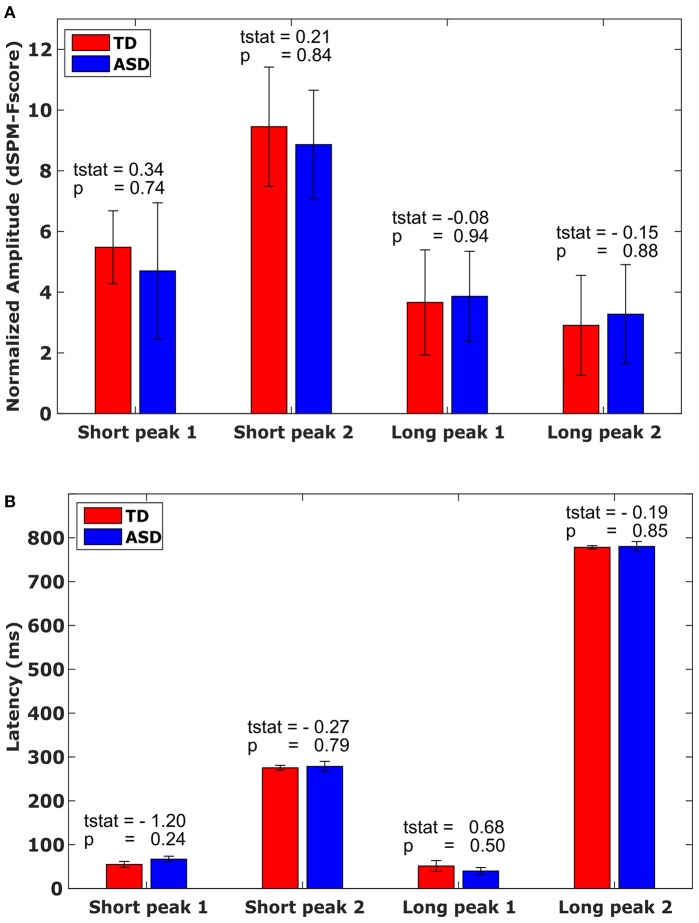
Figure 2.
Amplitude and Latency. (A) Mean amplitude values with associated standard error for each M40 peak in the short and long evoked response conditions, by group, averaged across the time window marked in Figures 1C,D. (B) Mean latency values with associated standard error for each M40 peak in the short and long evoked response condition, by group. Bars mark the standard error.

