
Fig. 3.
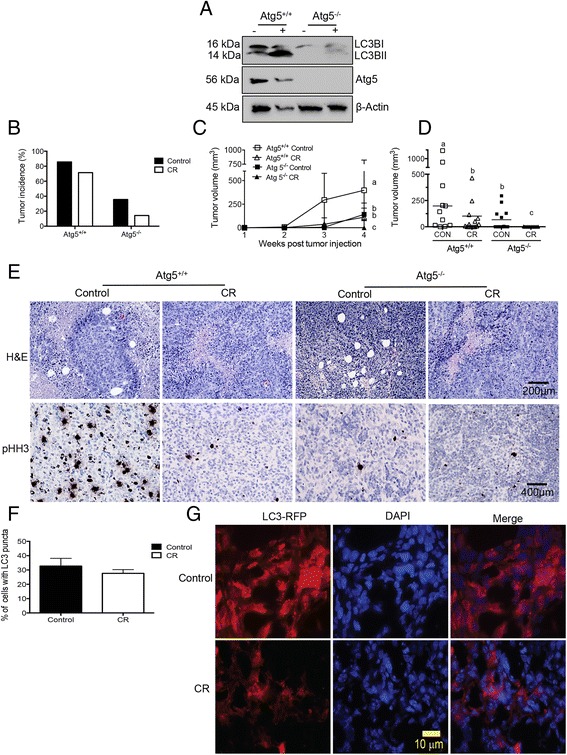
Autophagy inhibition and CR reduce tumor growth. a Immunoblot analysis of Atg5 expression and LC3B cleavage in Atg5 +/+ ;Hras V12 iBMK cells or Atg5 −/− ;Hras V12 iBMK cells incubated with or without 10 μM chloroquine (CQ). Atg5 +/+ or effect of autophagy inhibition and CR on tumor incidence (b), tumor growth (c), and final tumor volume (d). Atg5 −/− mice were transplanted into nude mice fed either a control or CR diet (n = 14/diet and genotype), and tumor volume was measured weekly. e Representative H&E (i) and Ki67 IHC staining (ii) images of Atg5 +/+ and Atg5 −/− tumors from mice fed a control or CR diet. f Effect of CR, relative to control diet, on LC3 puncta formation and RFP-LC3 fluorescence in tumors from Atg5 +/+ ;Hras V12 iBMK cell transplants. g Fluorescence microscopy of RFP-LC3 expressing Atg5 +/+ tumor slices from mice fed a control or CR regimen. Graphs presented are mean ± SEM and values with different letters are significantly different at p <0.05