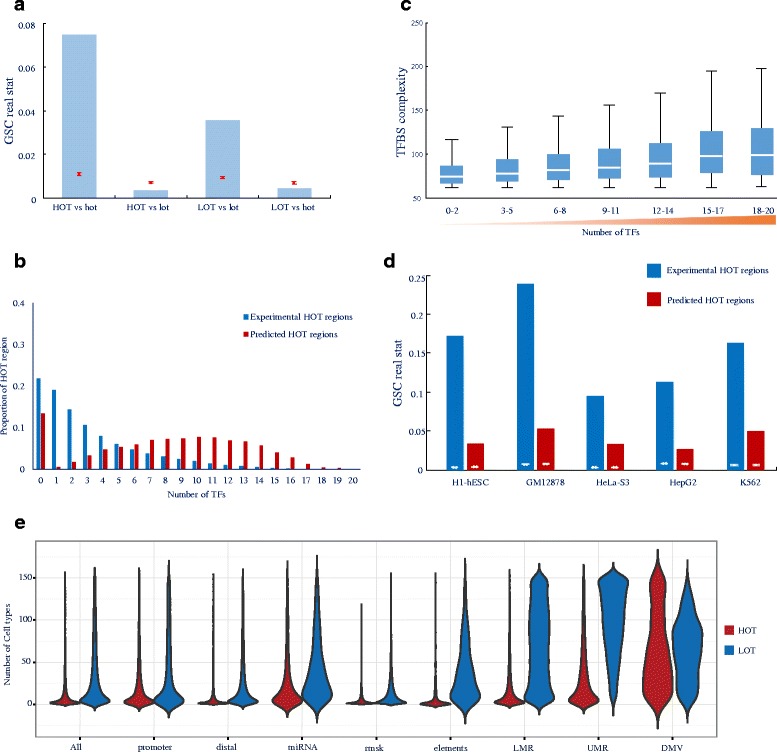
Fig. 1.

Identification and validation of HOT regions a Error bar showing the GSC results for HOT/LOT regions versus experimental HOT/LOT regions. Red lines indicate the mean and normalised SD of 10,000 bootstrap samples; the blue bar indicates the real statistics. b The proportions of HOT regions and experimental HOT regions containing different numbers of ChIP-seq peaks corresponding to TFs in H1 cells. c The distributions of TF complexity of HOT regions containing different numbers of ChIP-seq peaks corresponding to TFs in H1 cells. d Error bar showing the GSC results of HOT regions versus motifless binding peaks. White lines indicate the mean and normalised SD of 10,000 bootstrap samples; blue and red bars indicate the real statistics of experimental HOT regions and our predicted HOT regions, respectively. e Distributions of the number of cell types, from 1 to 154 (y axis), in which HOT (red) and LOT (blue) regions in each of nine classes (x axis) are observed. The width of each shape at a given y value shows the relative frequency of regions present in that number of cell types. See also Additional file 1: Figures S1–S3 and Additional file 2: Tables S1–S5
