
Fig. 4.
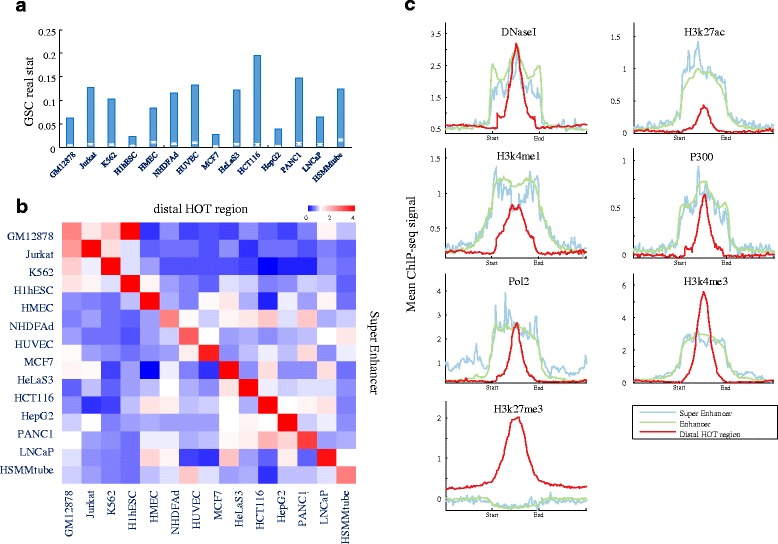
Association of distal HOT regions with super-enhancers a Error bar showing the GSC results between distal HOT regions and super enhancers. Red lines indicate the mean and normalised SD of 10,000 bootstrap samples; blue bar indicates the real statistics. b Distal HOT regions colocalise with super-enhancers in a cell type-specific manner. Cell type-specific super-enhancers (y-axis) are mapped relative to cell-specific distal HOT regions (x-axis) in 14 different cell types. c ChIP-seq binding profiles of super-enhancers, enhancers, and distal HOT regions for the indicated DNaseI and enhancer-relevant markers, including transcription factors, transcriptional cofactors, chromatin regulators, and RNA polymerase II in ESCs. See also Additional file 1: Figure S5