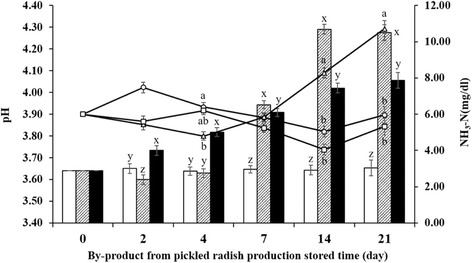
Fig. 1.

Changes in pH and ammonia nitrogen (NH3-N) concentration during storage at three different temperatures. The pH at low (4 °C, ○); room (20 °C, △); and high (37 °C, □) temperatures and the NH3-N concentrations at low (4 °C, open bar); room (20 °C, shaded bar); and high (37 °C, solid bar) temperatures. Each error bar represents the standard error of the mean temperature on each day. a-cMeans of pH that do not have common superscript differ (P < 0.05). x-zMeans of NH3-N concentration that do not have common superscript differ (P < 0.05)
