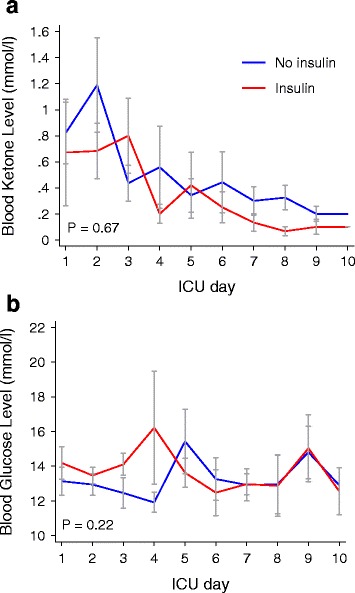
Fig. 1.

Mean (SEM) blood ketone levels (a) and blood glucose levels (b) in patients with (red line) and without (blue line) insulin therapy. Only patients with a blood glucose level above 10 mmol/l at each time point included. P values represent the between-group comparison on repeated-measures analysis of variance
