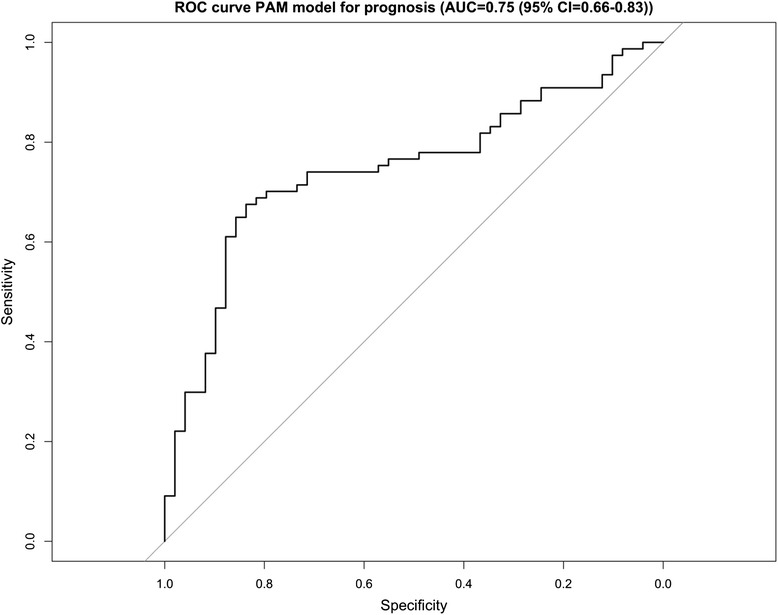
Fig. 3.

Performance of a gene-expression based supervised predictor in classifying prognosis. ROC curve illustratrating the performance of a gene-expression based supervised classifier in correctly predicting the prognostic group (good or poor prognosis) to which each patient belongs, over 10 rounds of cross-validation. The classifier was determined using Prediction of Microarray (PAM) analysis, and was limited to 100 genes, which were differentially expressed between good and poor prognosis patients
