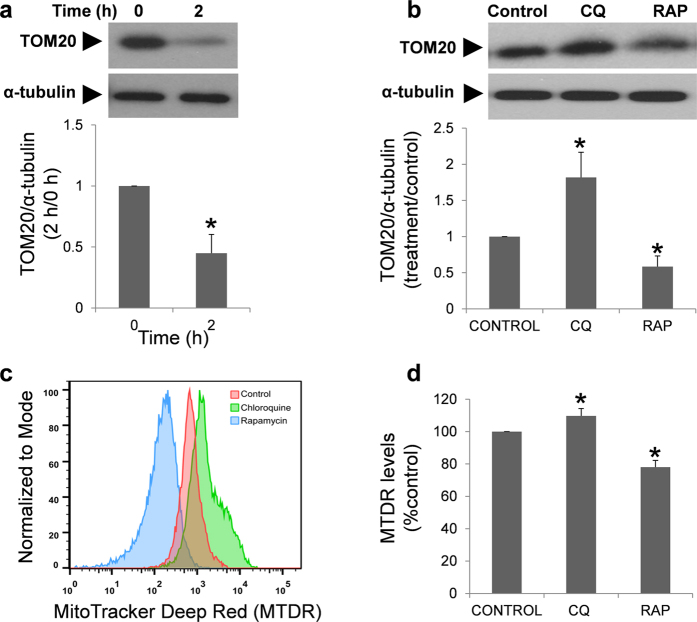
Figure 14. TOM20 protein and MitoTacker Deep Red (MTDR) fluorescence regulated by chloroquine and rapamycin.
Regulation of TOM20 protein was studied in fresh and after 2 hours of incubation (a) and in the presence of chloroquine (50 μM) and rapamycin (100 nM) (b). Proteins were extracted, resolved and detected with specific antibody. Data from TOM20 was normalized respect to α-tubulin. Columns with asterisk indicate significant differences (P < 0.05) respect to control (containing vehicle). n = 4. CQ: chloroquine; RAP: rapamycin. MTDR (c,d) was used to determine mitochondrial staining by flow cytometry in cells incubated in the presence of chloroquine (50 μM) and rapamycin (100 nM). Figure (c) is a representative and normalized histogram of the MTDR fluorescence obtained after treatment with rapamycin (blue) and chloroquine (green) for 2 hours. Figure (d) represents the mean of MTDR fluorescence of four different experiments and normalized respect to control. Columns with asterisk indicate significant differences (P < 0.05) respect to control (containing vehicle). CQ: chloroquine; RAP: rapamycin.

