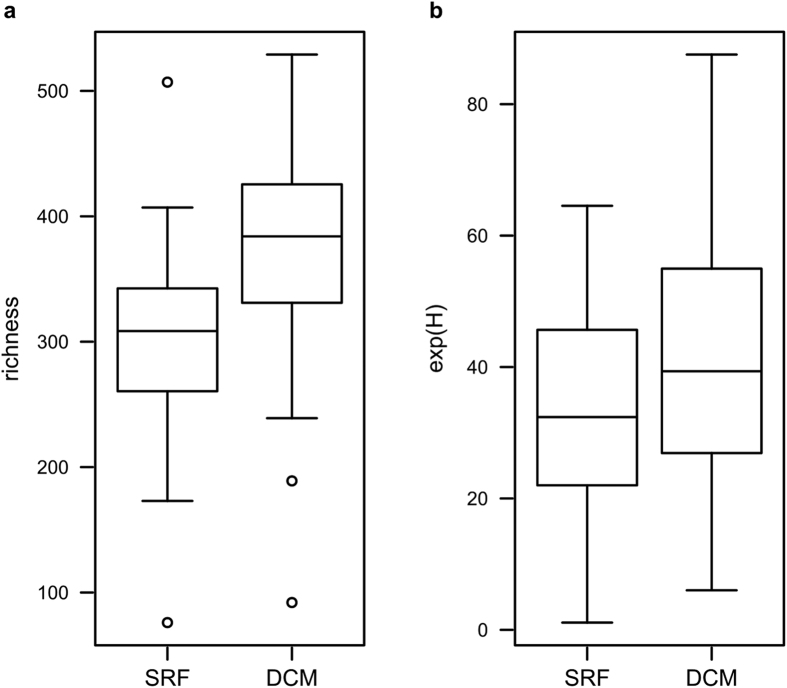
Figure 5. Comparison of diversity in surface and DCM communities.
Ciliate OTU richness (a) and ciliate OTU diversity (exp(H), b) of surface water and DCM samples were depicted as box-whisker-plots. Only 36 sampling stations, of which surface waters and DCM samples were both available, were included in the analysis.

