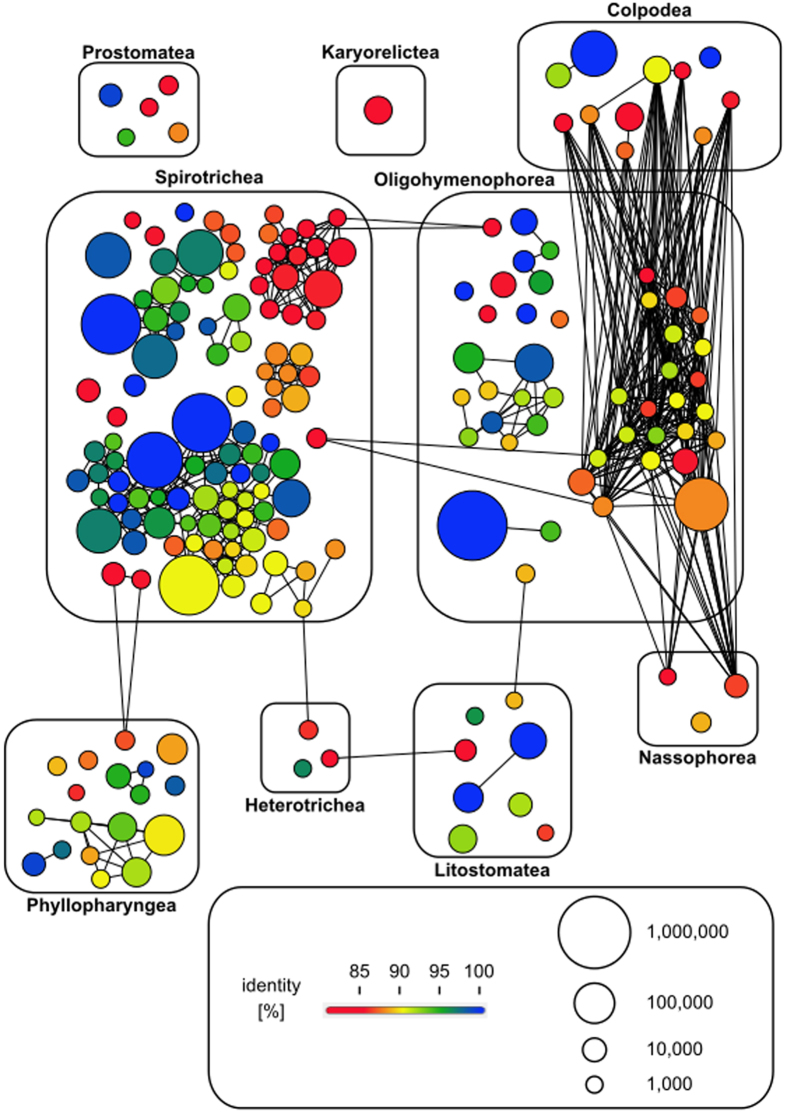
Figure 6. Novel ciliate genetic diversity network of 200 most abundant swarms pooled over depth and oceanic region.
Each node in the network represents one swarm. Two nodes are connected by an edge if they share a sequence similarity of at least 90%. The size of a node indicates the number of reads in a swarm. Nodes are colored according to the percentage of identity of the swarms to the closest reference sequences in GenBank. Minimum identity is 80% (red).

