FIGURE 7.

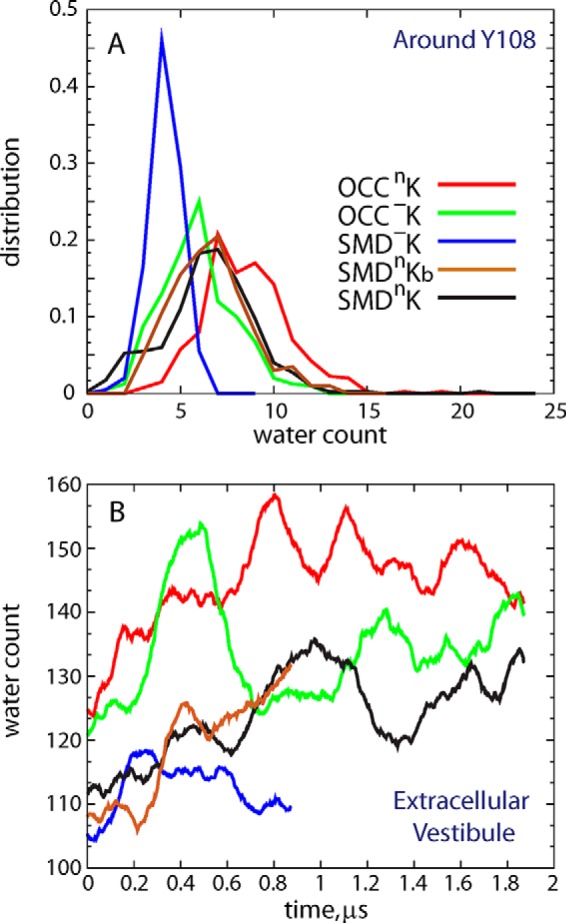
A, distribution of the water molecule count around residue Tyr108 (i.e. waters within 3 Å of any atom of Tyr108) in different simulations. B, time evolution of the overall water count in the EC vestibule of LeuT in various simulations.

A, distribution of the water molecule count around residue Tyr108 (i.e. waters within 3 Å of any atom of Tyr108) in different simulations. B, time evolution of the overall water count in the EC vestibule of LeuT in various simulations.