FIGURE 1.
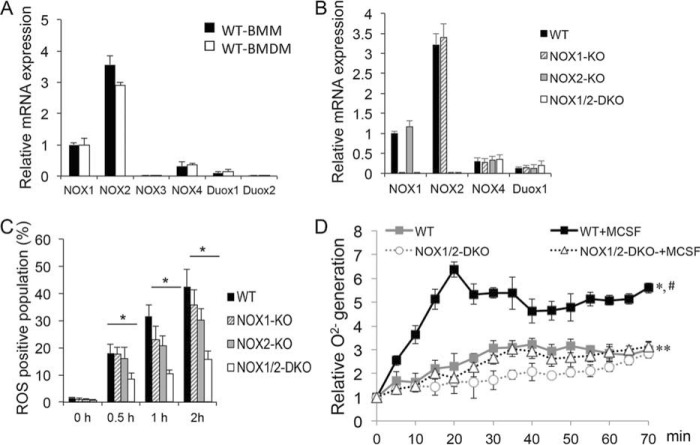
NOX1 and NOX2 depletion inhibited ROS production and O2˙̄ generation in monocytes. A, the expression levels of the NOX family (NOX1, NOX2, NOX3, NOX4, Duox1, and Duox2) in mouse BMMs and BMDMs were detected by real-time PCR assay. B, the expression levels of NOX1, NOX2, NOX4, and Duox1 in BMDMs from WT, NOX1-KO, NOX2-KO, and NOX1/2-DKO mice were detected by real-time PCR assay. C, mouse BMMs from WT, NOX1-KO, NOX2-KO, and NOX1/2-DKO mice were treated with M-CSF (20 ng/ml) at the indicated time points. Cells were stained with CM-H2DCFDA for 30 min and then washed and fixed. The percentage of DCFDA-positive population was quantified by flow cytometry. D, mouse BMMs from WT and NOX1/2-DKO mice were collected. Lucigenin (200 mm) was added, and chemiluminescence was measured after treatment with or without M-CSF (20 ng/ml) over the indicated time period. Relative O2˙̄ generation was determined relative to the relative light units per second at the 0 time point for each group. *, p < 0.05 at all time points when WT+MCSF compared with WT baseline; #, p < 0.05 at all time points when WT+MCSF compared with NOX1/2-DKO+MCSF; **, p < 0.05 at most time points when NOX1/2-DKO baseline compared with WT baseline.

