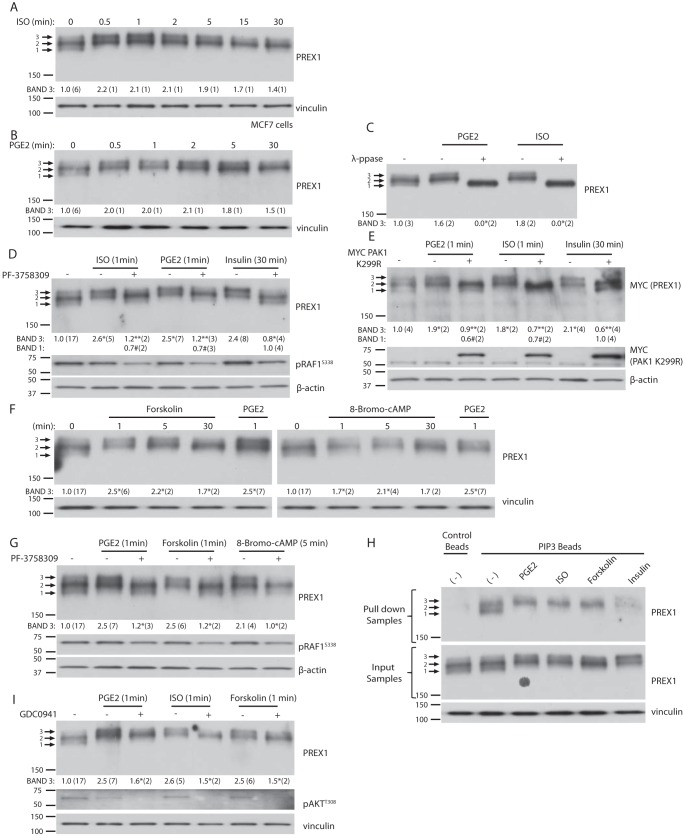
FIGURE 4.
Isoproterenol and prostaglandin E2 stimulation lead to a PAK-dependent mechanism of phosphorylation for PREX1 that is distinct from receptor tyrosine kinase activation. For all quantified Western blots, the ratio of the intensity of band 3 or band 1 (as indicated) by densitometry to that of total PREX1 (or MYC-tagged PREX1) protein was calculated, and the number of independent samples used for each quantification is shown in parenthesis. A, Western blotting analysis of MCF7 cells that were starved and then treated with 1 μm of isoproterenol (ISO) for the indicated times. Band 3 was quantified as described above. B, Western blotting analysis of MCF7 cells that were starved and then treated with 10 nm of PGE2 for the indicated times. Band 3 was quantified as described above. C, Western blotting analysis of λ-phosphatase (λ-ppase) or mock-treated cell lysates from MCF7 cells that were treated with PGE2 or isoproterenol for 1 min. Band 3 was quantified as described above. *, p < 0.05 compared with the corresponding mock-treated sample for that treatment. D, Western blotting analysis of MCF7 cells that were treated with 1 μm of PF-3758309 (PAKi) for 15 min, followed by treatment with isoproterenol or PGE2 for 1 min or 5 μg/ml insulin for 30 min. Either band 3 or band 1 was quantified as described above. *, p < 0.05 compared with the starved sample for band 3; **, p < 0.05 compared with the corresponding ligand treatment without PF-3758309 for band 3; #, p < 0.05 compared with the insulin- and PF-3758309-treated sample for band 1. E, Western blotting analysis of MCF7 cells expressing MYC PREX1 with or without co-expression of MYC PAK1 K299R. Cells were starved and treated with isoproterenol or PGE2 for 1 min or insulin for 30 min. Either band 3 or band 1 was quantified as described above. *, p < 0.05 compared with the starved sample for band 3. **, p < 0.05 compared with the corresponding ligand treatment without MYC PAK1 K299R co-expression for band 3; #, p < 0.05 compared with the insulin-treated sample with co-expression of MYC PAK1 K299R for band 1. F, Western blotting analysis of MCF7 cells that were starved and then treated with 100 nm forskolin, 500 μm 8-bromo-cAMP, or 10 nm PGE2 for the indicated times. Band 3 was quantified as described above. *, p < 0.05 compared with the starved sample. G, Western blotting analysis of MCF7 cells that were treated with 1 μm of PF-3758309 (PAKi) for 15 min, followed by treatment with PGE2 or forskolin for 1 min, or 8-bromo-cAMP for 5 min. Band 3 was quantified as described above. *, p < 0.05 compared with the corresponding ligand treatment without PF-3758309. H, Western blotting analysis of PIP3 bead pulldowns from MCF7 cells that were starved and treated with PGE2 or isoproterenol for 1 min, forskolin for 5 min, or insulin for 30 min. A representative blot is shown of two independent experiments. I, Western blotting analysis of MCF7 cells that were treated with 500 nm of GDC0941 (PI3Ki) for 15 min, followed by treatment with PGE2, isoproterenol, or forskolin for 1 min. Band 3 was quantified as described above. *, p < 0.05 compared with the corresponding ligand treatment without GCD0941. Phosphospecific antibodies to AKT (Thr-308) and RAF1 (Ser-338) were used to detect signaling alterations.

