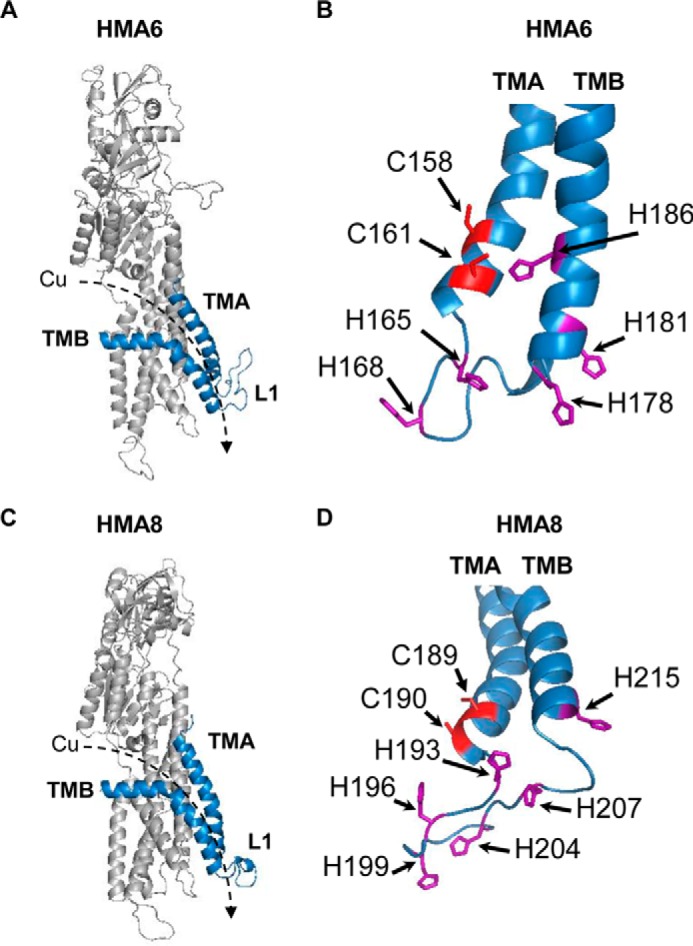
FIGURE 3.

Structural models of HMA6 and HMA8 from A. thaliana. A and C, structural models were obtained from the structure of LpCopA (Protein Data Bank code 4BBJ) (21) with the MODELLER program (40) as previously described (9). The TMA and TMB helices are shown in blue. The dashed arrows indicate the orientation of copper transport. B and D, focus on the cysteine and histidine residues found in the TMA-L1-TMB region of HMA6 (B) and HMA8 (D).
